The U.S. Stock Market Is Set for a Fall
Disclosure: We are reader-supported. If you purchase from a link on our site, we may earn a commission. Learn more
Last Updated on: 26th April 2021, 09:07 pm
In the old, pre-crisis days, it was not odd to think that bad news for bonds was good news for stocks. It made sense from a fundamental perspective. Fixed-income markets tend to do poorly when economic activity is strong or inflation is rising; in contrast, such conditions can boost corporate bottom lines and make equities seem attractive. Given my thoughts about the former, some might assume I'm upbeat on the latter.
However, that is not the case. While it is generally foolhardy to repeat those famous last words, “this time is different,” there is reason to believe that it is true right now. Or, more accurately, that what comes next will be a repeat of some rare and unwelcome times in stock market history. Aside from the fact that the biggest cheerleader for higher asset prices, the Federal Reserve, is set to change course and tighten policy, there are a variety of fundamental, technical and sentiment factors that suggest the path of least resistance for share prices is down.
That doesn't necessarily mean things will unfold as I expect, of course. As economist John Maynard Keynes once said, “the market can stay irrational longer than you can stay solvent.” But at some point, when the trickle of negative developments turns into a flood, the bulls are overwhelmed and prices decline. Based on the following, it seems like the moment of truth has finally arrived.
Economic Conditions
It is not uncommon for Wall Street to diverge from Main Street, but sooner or later the two must meet. Over the long run, stocks are valued based on what the underlying businesses earn. Those earnings, in large measure, depend on how the economy overall is doing. Historically, in fact, measurable slowdowns in economic activity have been associated with notable declines in share prices. There are a number of data points and trends that suggest the outlook for the economy is poor; below are just a few.
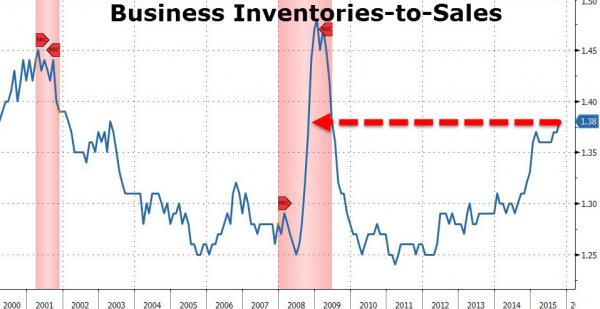
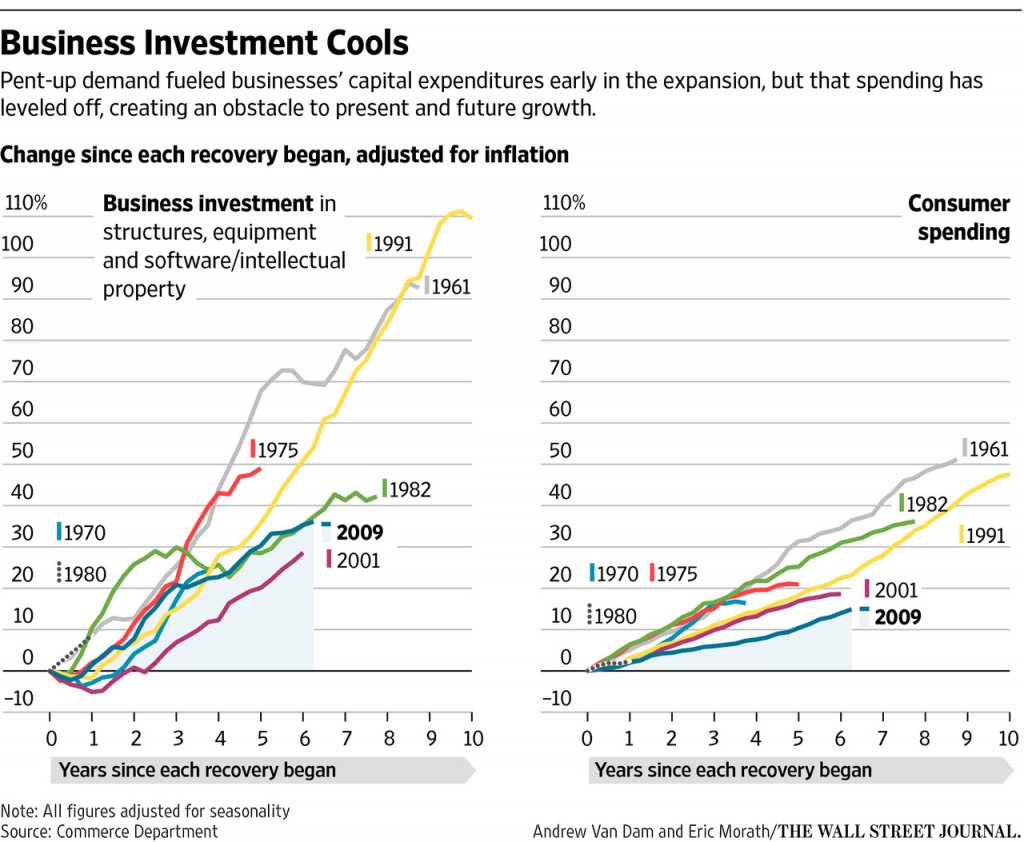
Business sales, inventory and investment
In all three cases, the data indicate that conditions on Main Street have been deteriorating. At best, they signal sluggishness; at worst, they suggest the U.S. economy is in or headed into a recession.
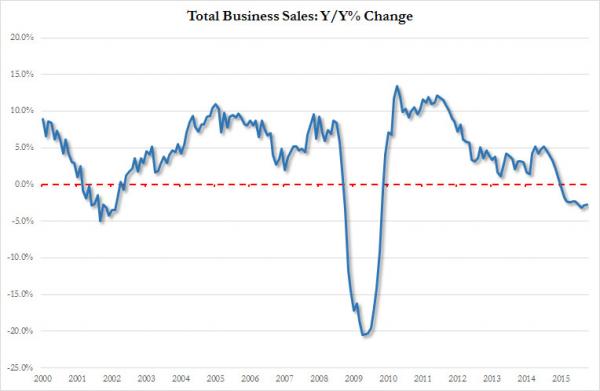
(Source: Zero Hedge)
(Source: Zero Hedge)
(Source: Wall Street Journal)
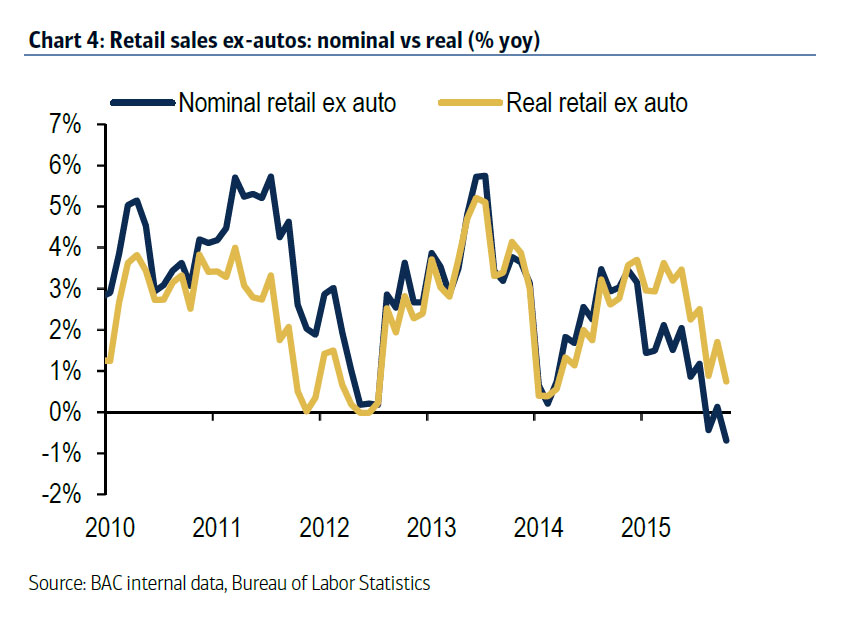
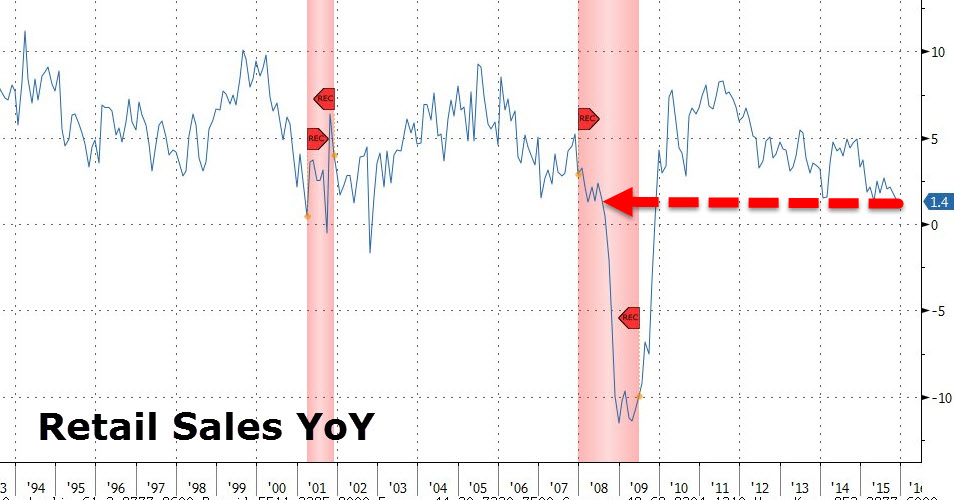
Retail Sales
Many analysts have argued that falling gasoline prices and an apparent uptick in wage rates would spark a U.S. consumer spending spree. While some parts of the economy have clearly benefited, most notably the auto industry, the data below suggest that the consumer is retrenching. (Note: The first chart is derived from credit card spending, while the second is based on U.S. Census Bureau data)
(Source: Zero Hedge)
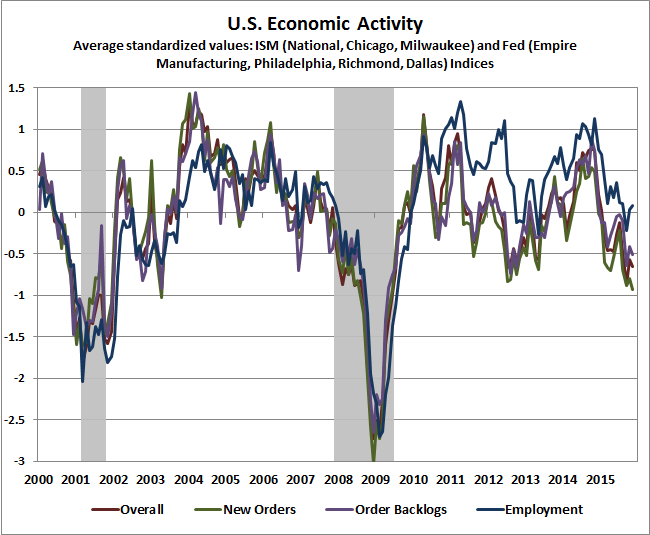
Overall Activity
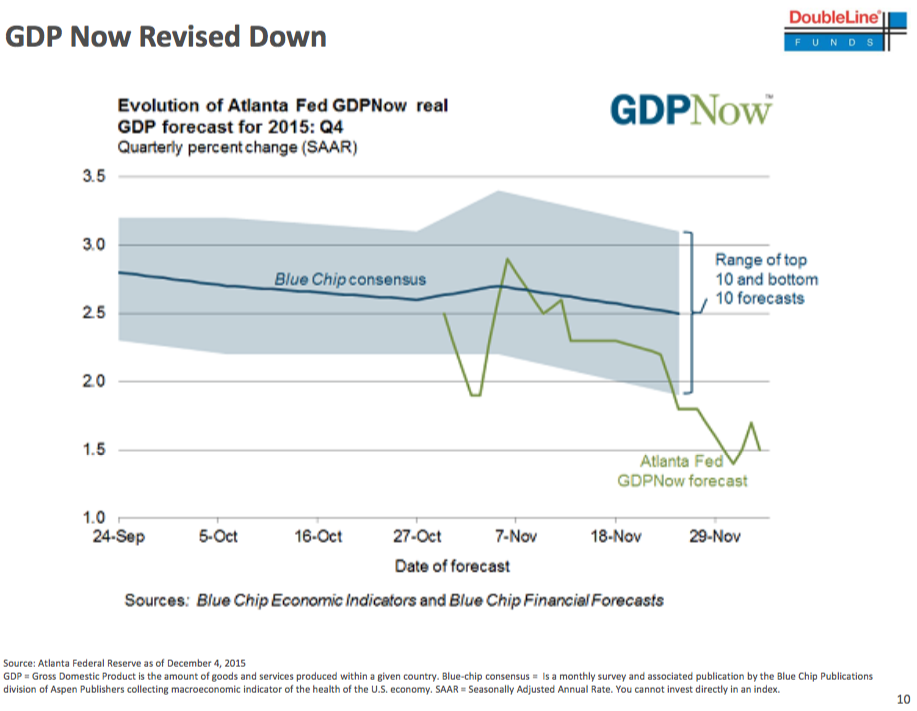
Although some broad-based indicators paint a picture that seems less than clear-cut about the economy's future direction, the following two charts suggest the economic risks are to the downside.
(Source: Hussman Funds)
(Source: Business Insider)
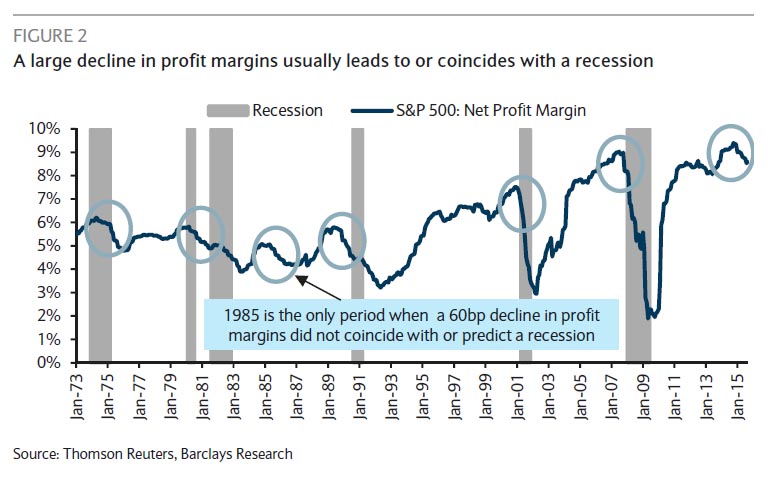
Profit Margins
It's probably no surprise to learn that faltering profit margins have historically served as an early warning sign of trouble ahead for the U.S. economy. With that in mind, the near-term outlook looks anything but promising.
(Source: Zero Hedge)
Financial Conditions
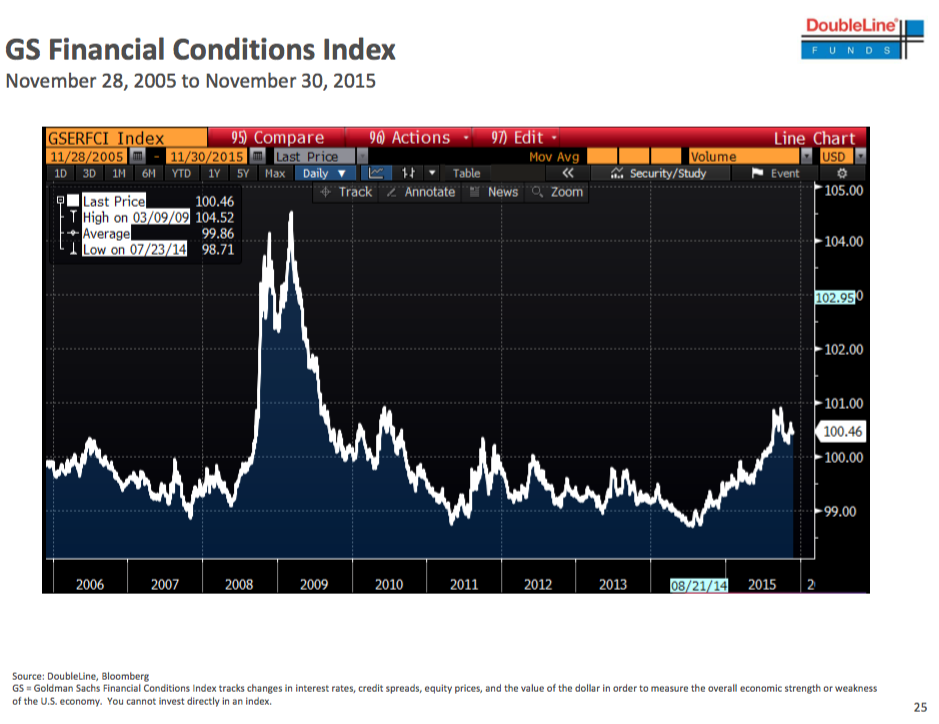
As we learned in 2008, its not just what is happening on Main Street that matters; conditions on Wall Street also reveal quite a lot about the health of the economy. Based on where the Goldman Sachs Financial Conditions Index is currently trading, the message is not reassuring.
(Source: Business Insider)
Valuation
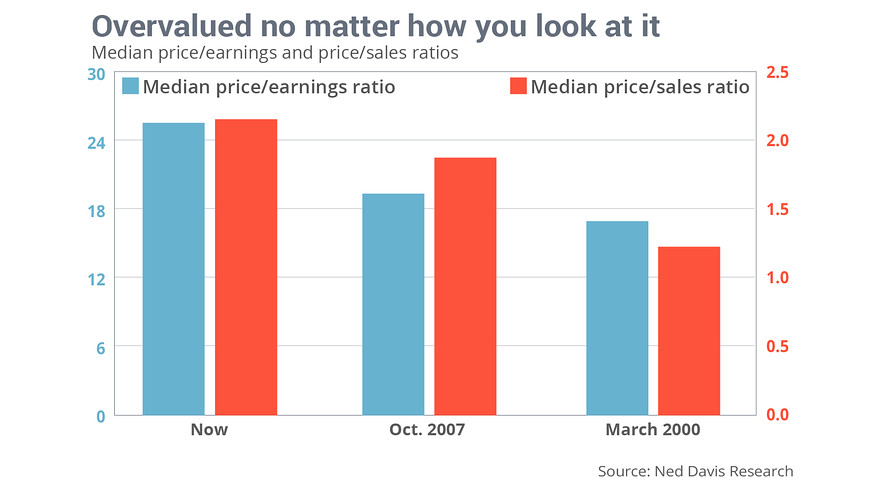
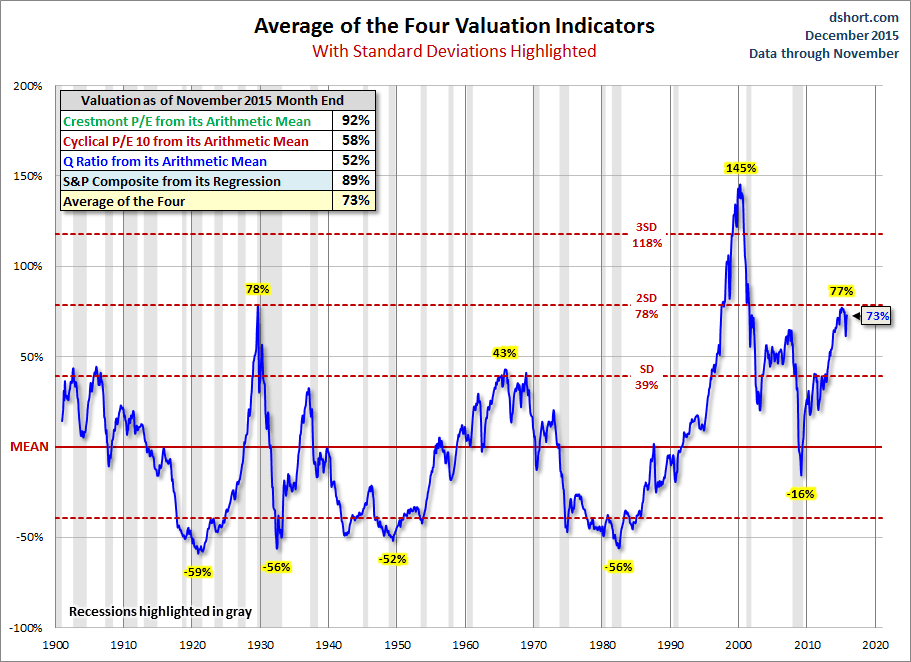
A deteriorating economy isn't the only thing that can undermine share prices. History suggests they can also fall of their own accord–sometimes suddenly and without any catalyst at all–if they become overly rich by historical standards. Right now, that seems to be right where things are.
(Source: MarketWatch)
(Source: Advisor Perspectives)
Revenues and profits
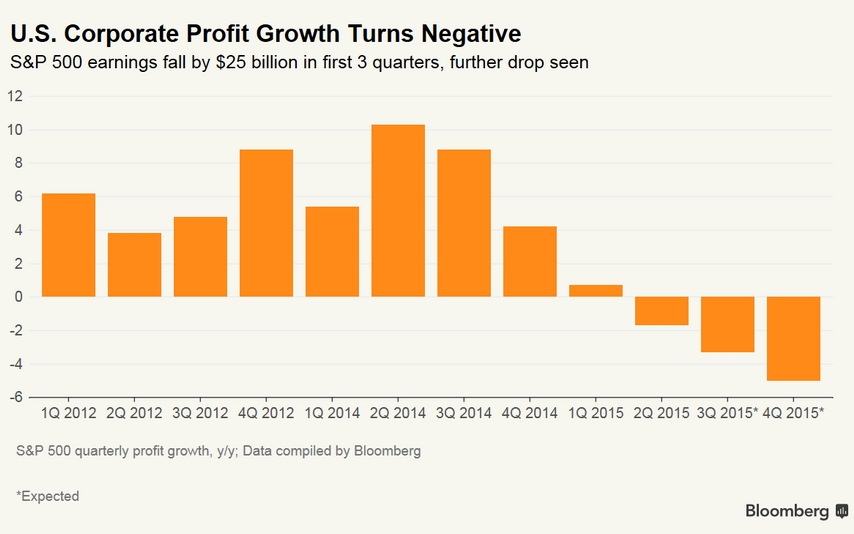
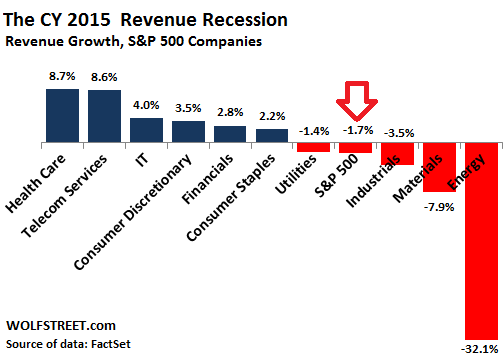
It's long been said that profits are the “mother's milk” of equity returns. In terms of today's operating environment, both sales and earnings look to be running dry.
(Source: Bloomberg)
(Source: Seeking Alpha)
Margins and stock prices
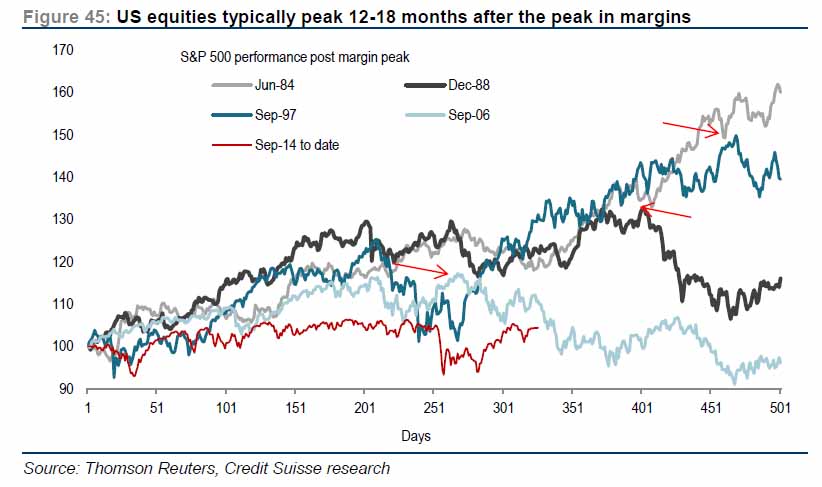
Profit margins aren't just, as noted above, a leading economic indicator. History suggests they are also a leading indicator for share prices. Given how much time has elapsed since they hit their peak, the bull market doesn't appear to have much time remaining.
(Source: Zero Hedge)
Supply and Demand
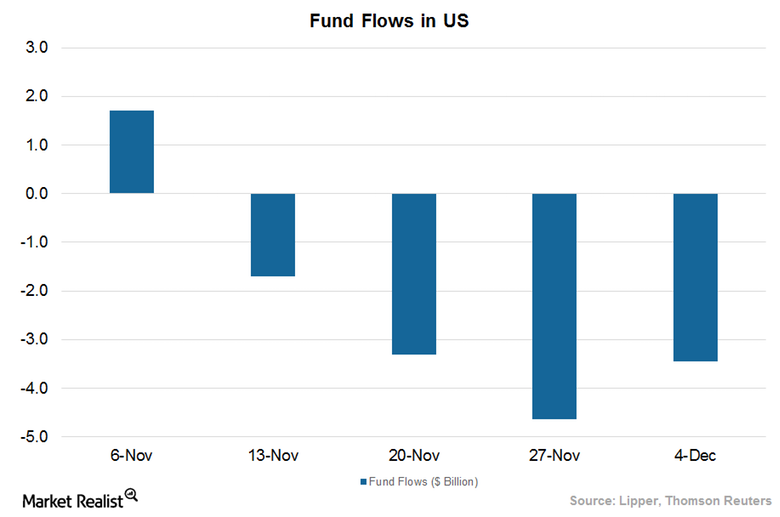
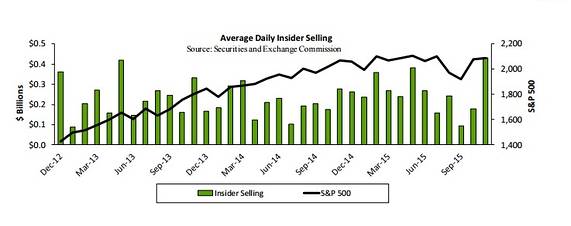
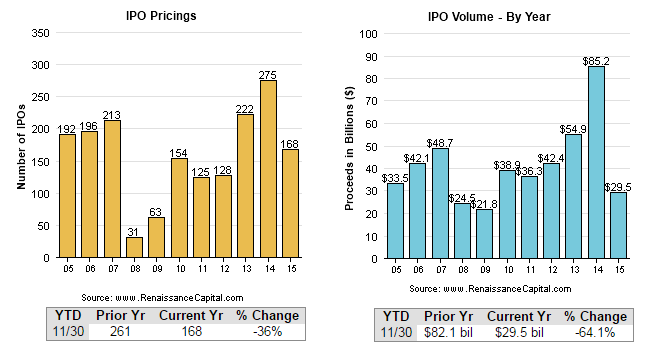
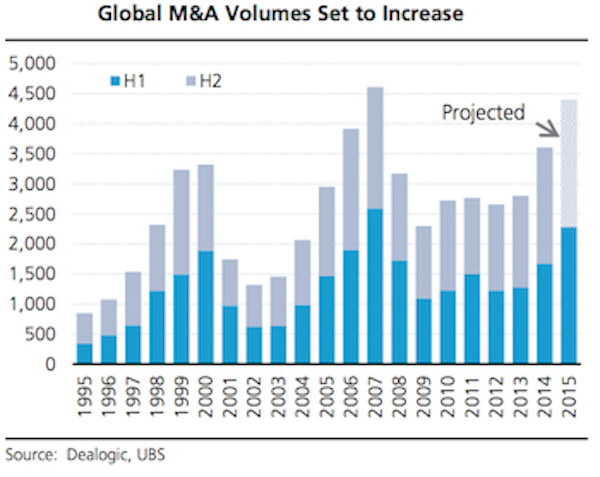
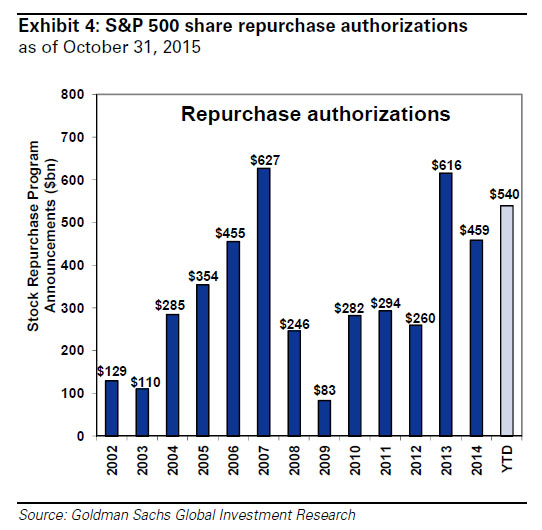
As with most markets, stocks need fuel to rally, but they can fall of their own weight. Recent fund flows and net selling by corporate insiders is not supportive, while the IPO market, which often serves as a bellwether of investors' appetite for stocks, appears to have peaked in 2014. While some might argue that still-strong M&A activity can support share prices, it is probably no coincidence that this year's volume is within a hair's breadth of where it was at the 2000 and 2007 S&P 500 index peaks. Some are betting that renewed buying by corporations of their own stock (in contrast to what their senior executives are doing) will be enough to keep the momentum alive, despite the growing reliance on borrowed money and financial engineering to fund these purchases. Maybe they're right, but the odds seem against it.
Source: Market Realist)
(Source: Barron's)
(Source: Renaissance Capital)
(Source: Ansarada)
(Source: Zero Hedge)
Credit Conditions
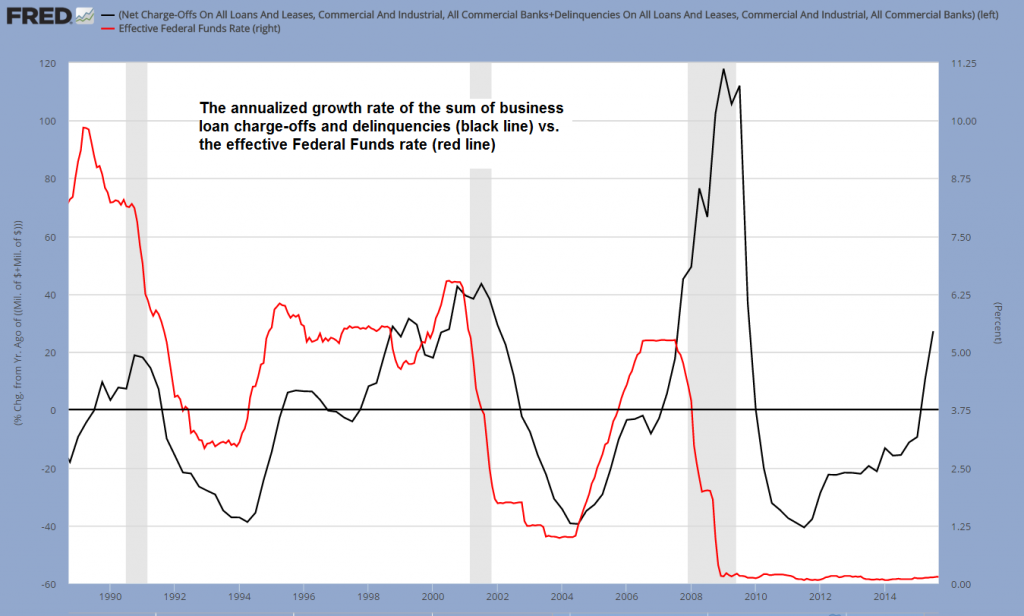
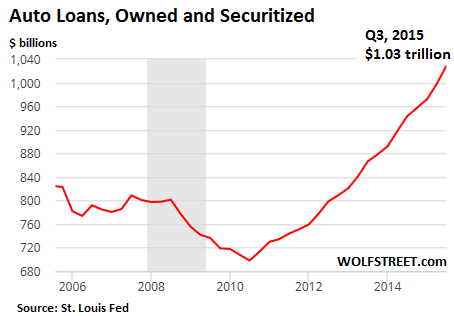
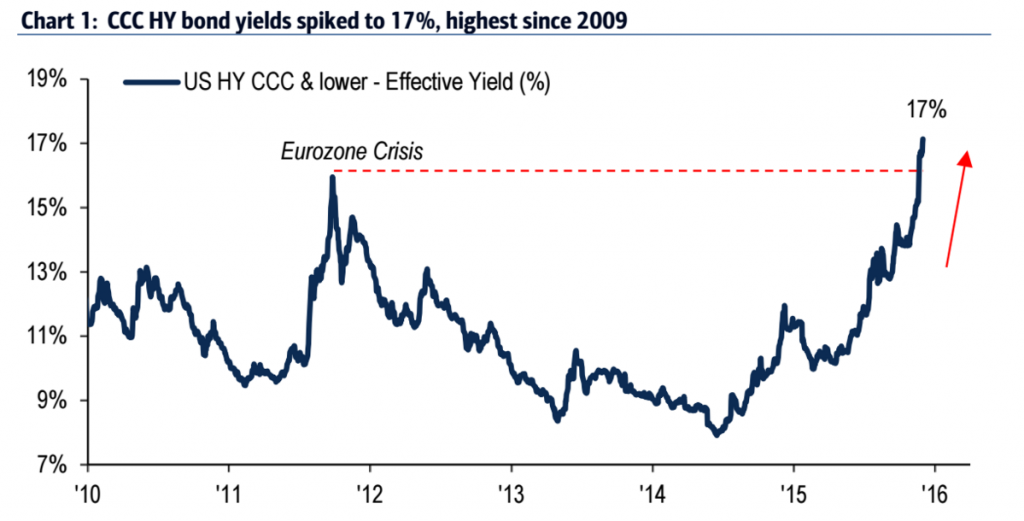
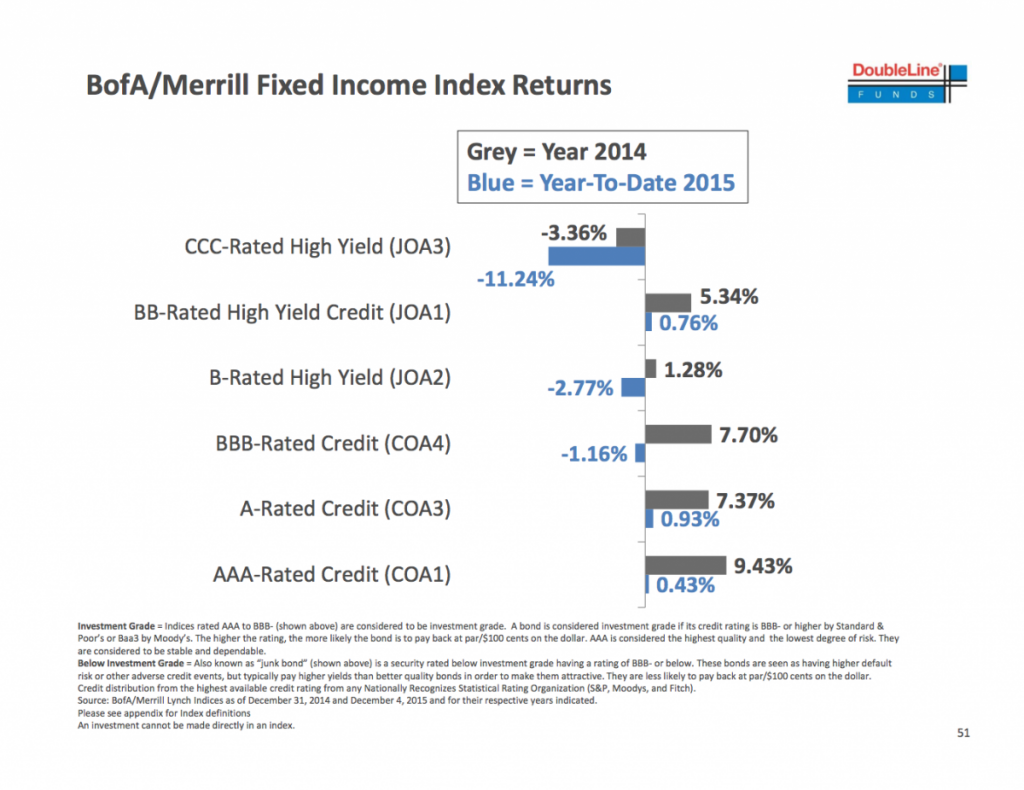
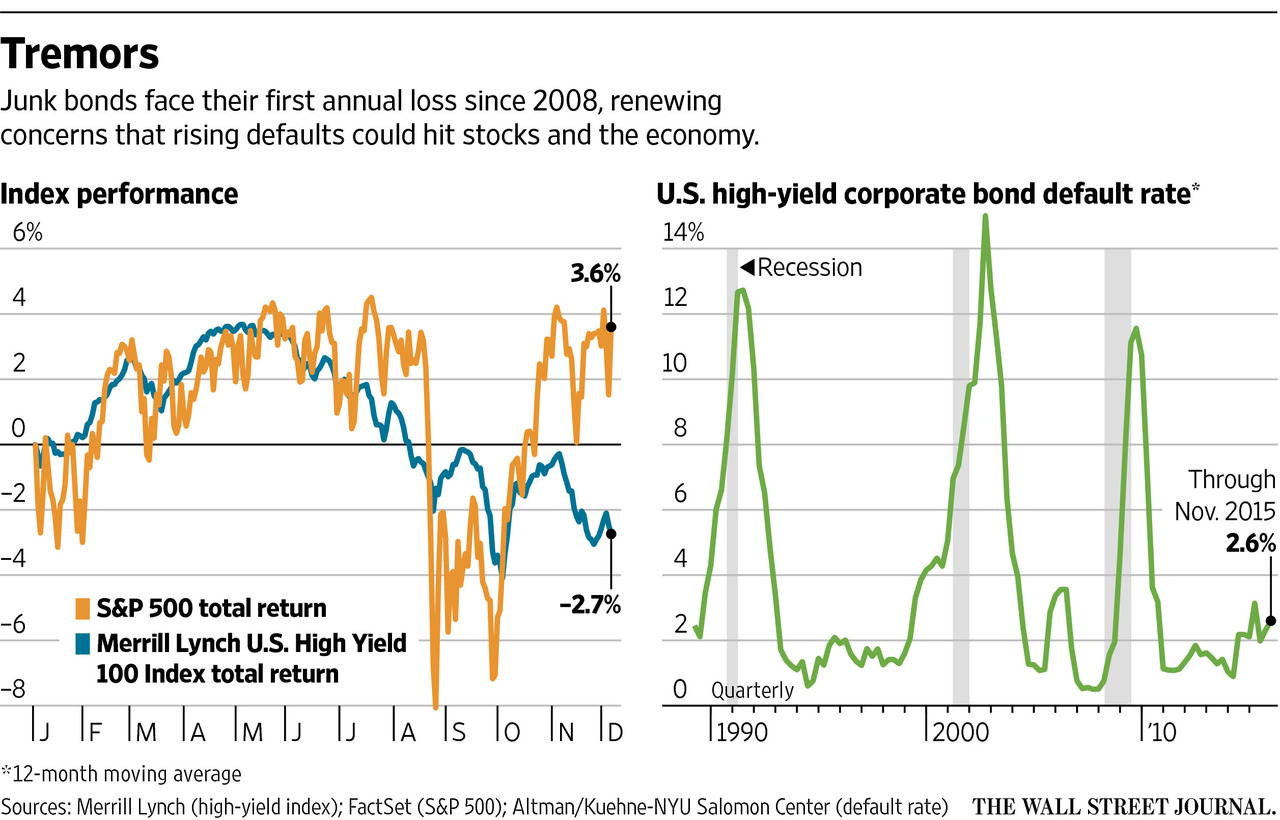
The big story in recent weeks has been the growing turbulence in high yield bond markets and the alarming news that a distressed debt fund has suspended withdrawals. But things have been deteriorating in many parts of the fixed-income markets for some time, as I noted in “Anything But Positive for Bond Markets.” In fact, as the following chart shows, the corporate lending market is also feeling the pressure. While auto loan financing is still a bright spot, reports that a growing share of the business is in subprime lending–a sector that played a big role in the global financial crisis–indicate it won't be long until the good times are over.
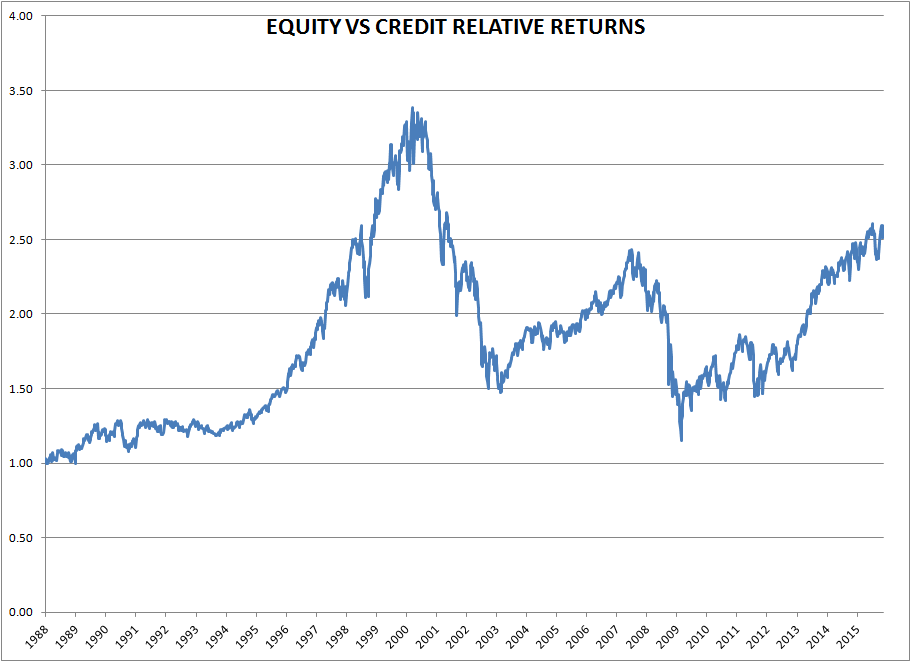
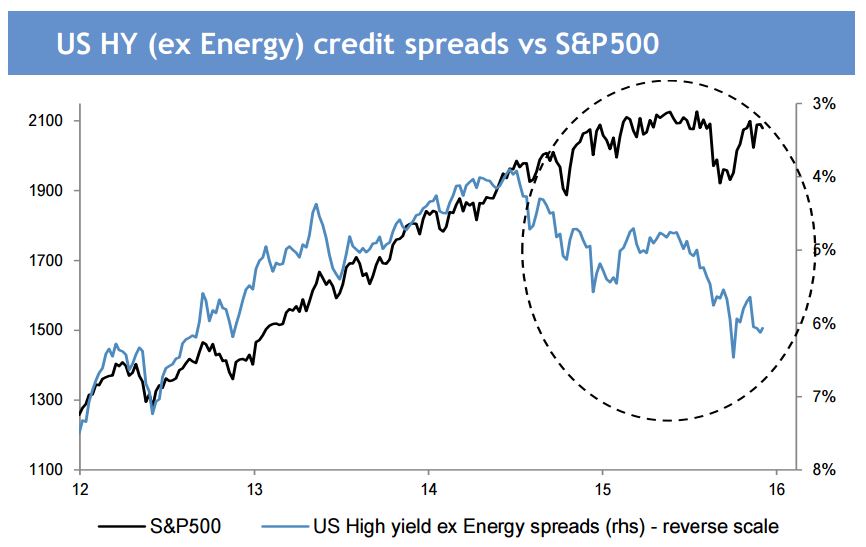
Regardless, as the latter charts in this section suggest, it's unlikely that equity markets can remain immune to issues that have slammed riskier segments of the fixed-income universe. Perhaps it's just a coincidence, but the fact that the relationship between stock and bond prices, as illustrated in “Equity vs Credit Relative Returns,” has approached levels last seen at the 2000 and 2007 market peaks suggests the infection will soon spread.
Business lending
Auto lending
High yield bonds
(Source: Business Insider)
(Source: Business Insider)
(Source: Wall Street Journal)
Equity vs. credit
(Source: Macro Man)
(Source: MarketWatch)
Currencies
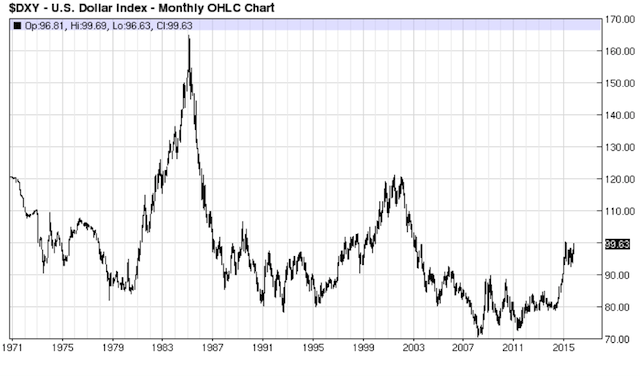
There have been periods when a stronger dollar has been good for share prices, but this time is unlikely to be one of them. Many U.S. multinationals and exported-oriented businesses have already noted the adverse impact that a stronger dollar has had on overseas sales and repatriated earnings, and have warned that further strength will be similarly negative. Moreover, as I argued in “Is the Conventional Wisdom Wrong About Gold?” the risk is that a destabilizing global bear squeeze will play a key role in sending the U.S. currency higher. Investors will likely avoid riskier securities and asset classes in response.
(Source: Forbes)
Technicals
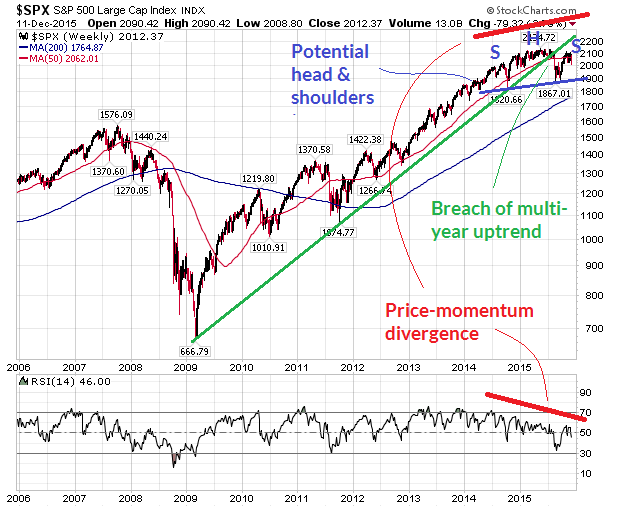
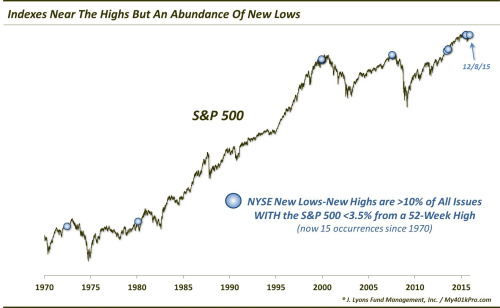
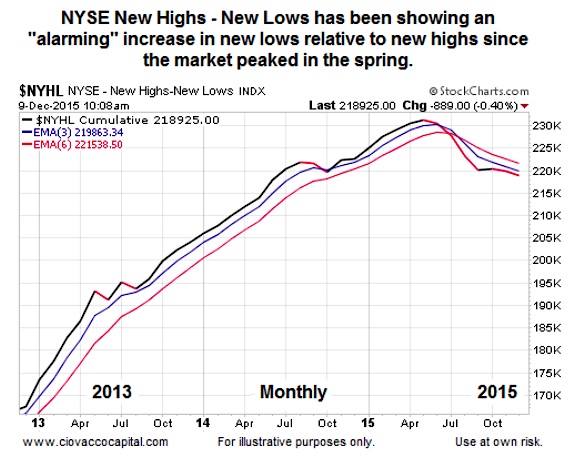
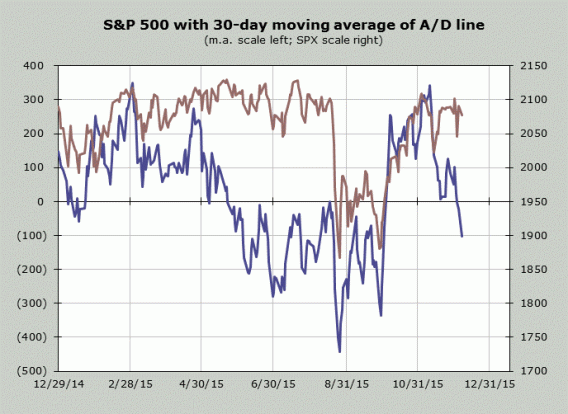
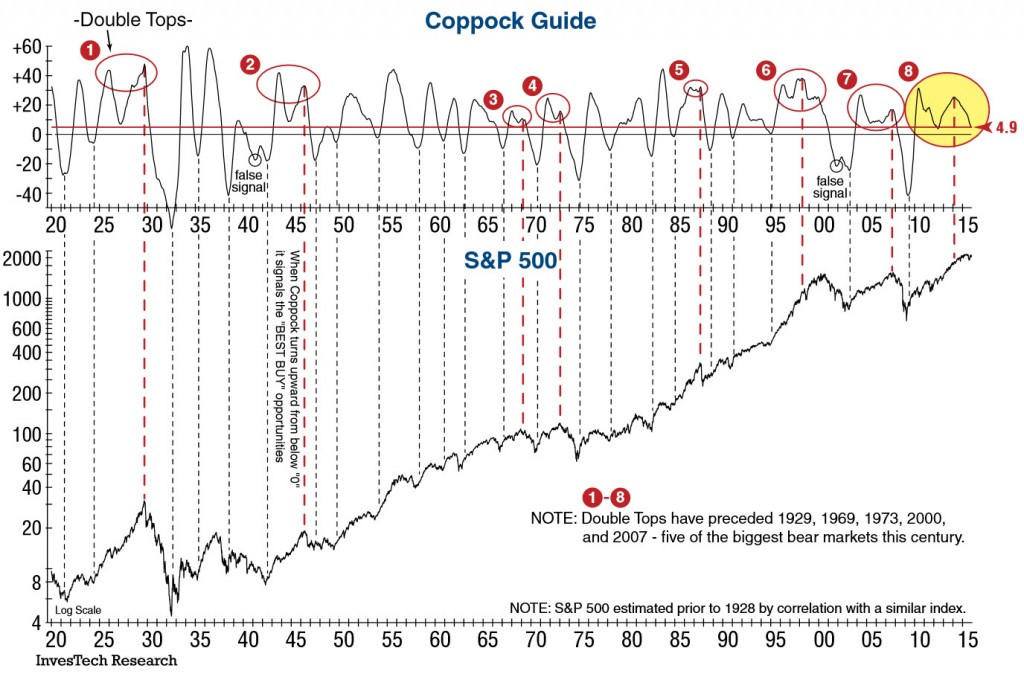
From where I sit, the big mistake that many technical analysts make is to view their charts and indicators in isolation. However, when fundamental, macro and other developments tell a story that jibes with the technical picture, that is often the set-up for a major move. In the case of equities, various charts describe a bull market that seems to be living on borrowed time. In fact, one long-term momentum gauge, the Coppock indicator, appears to be on the verge of signaling a secular change in trend.
(Unannotated chart: Stockcharts.com)
(Source: Zero Hedge)
(Source: See It Market)
(Source: Zero Hedge)
(Source: Zero Hedge)
Investor Sentiment
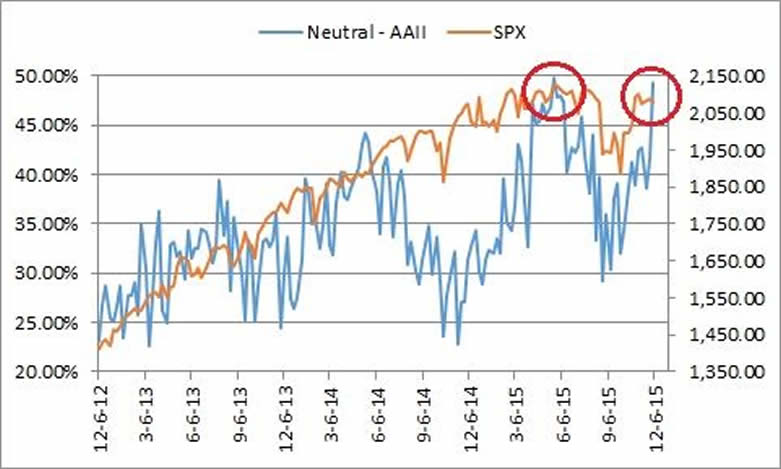
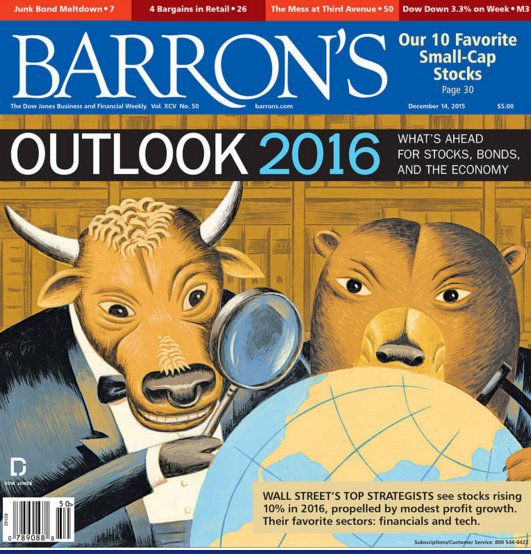
Assessing whether investors are overly bullish or bearish is more art than science. Sometimes, it requires only a small change in attitudes for a market to be considered “overbought” or “oversold,” and thus ripe for a contrarian reversal of fortunes. Given where other measures are pointing, it seems clear that investors are optimistic enough to be taken for an unexpected ride lower. The fact that this week's Barron's did not feature even one strategist who sees the market finishing lower in 2016 only serves to reinforce that point.
(Source: Market Oracle)
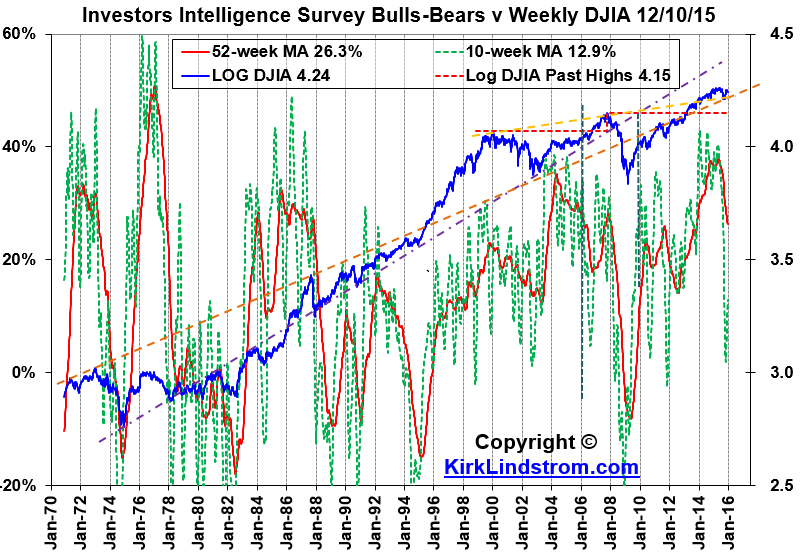
(Source: Seeking Alpha)
(Source: Business Insider)
Conclusion
If the outlook for bonds and stocks is so poor, some investors might be wondering about where they can put their money instead. While there is an argument to be made for holding cash and Treasurys, one option worth considering is an investment that many have come to hate.
Gold, anyone?


 Silver
 Gold
Gold Platinum
 Palladium
 Bitcoin
 Ethereum


 Gold: $4,079.98
 Silver: $50.27
 Platinum: $1,544.62
 Palladium: $1,390.49
 Bitcoin: $87,954.01
 Ethereum: $2,921.03