 Silver
 Gold
Gold Platinum
 Palladium
 Bitcoin
 Ethereum
Small Cap Value ETF: Which Ones Will Take off in 2024?
Disclosure: We are reader-supported. If you purchase from a link on our site, we may earn a commission. Learn more
Last Updated on: 22nd January 2024, 11:17 pm
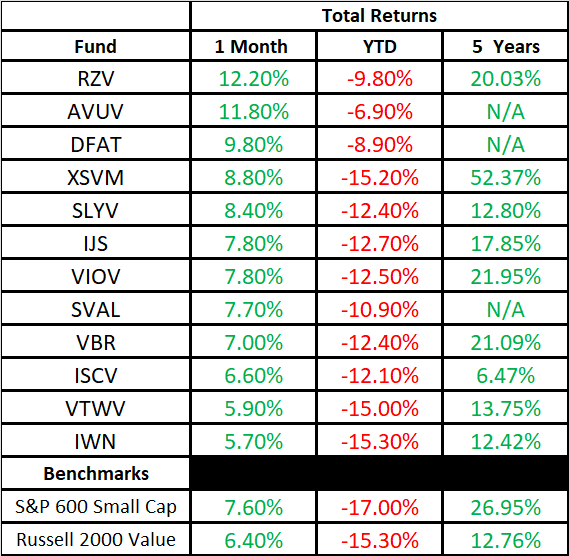
Looking for the small cap value ETF that will outperform in 2024? Here is our ranking of the 12 most popular small cap ETFs by 1-month performance. We take a look at each small cap ETF’s main characteristics and recent past performance.
We have also created a table with each small cap ETF’s performance compared to its peers and their relevant benchmark. Benchmarks are important to assess how well the manager of the fund is performing compared to the returns of a long only index of the broader market.
Note that some funds' objectives are to recreate the returns of the S&P 600 small cap index, while others have the objective of matching the returns on the Russell 2000 Value Index.
Table of Contents
- Why Invest in a Small Cap ETF?
- Small Cap Value ETF: Characteristics
- 1. Invesco S&P Small Cap 600 Pure Value ETF (NYSEArca: RZV)
- 2. Avantis U.S. Small Cap Value ETF (NYSEArca: AVUV)
- 3. Dimensional U.S. Targeted Value ETF (NYSEArca: DFAT)
- 4. Invesco S&P Small Cap Value with Momentum ETF (NYSEArca: XSVM)
- 5. SPDR S&P 600 Small Cap Value ETF (NYSEArca: SLYV)
- 6. iShares S&P Small Cap Value ETF (NYSEArca: IJS)
- 7. Vanguard S&P Small Cap 600 Value Index ETF (NYSEArca: VIOV)
- 8. iShares U.S. Small Cap Value Factor ETF (BATS: SVAL)
- 9. Vanguard Small Cap Value Index ETF (NYSEArca: VBR)
- 10. iShares Morningstar Small Cap Value ETF (NYSEArca: ISCV)
- 11. Vanguard Russell 2000 Value Index ETF (NASDAQ: VTWV)
- 12. iShares Russell 2000 Value ETF (NYSEArca: IWN)
- Conclusion
- Bottom Line
Why Invest in a Small Cap ETF?
As with all portfolios, the first factor you want to take care of is portfolio protection, even before you consider appreciation. Protecting your assets is fundamental. To that intent, it's considered wise to diversify your portfolio. Like the saying says, never put all your eggs in one basket.
For example, a stock portfolio may seem well diversified when holding an S&P 500 ETF. But you can diversify even further among different market caps and industry sectors. You should also diversify among assets and add alternative assets such as gold and silver, or cryptocurrencies.
Small Cap Value ETF: Characteristics
When choosing any ETF, we should always consider a few aspects. Liquidity, cost, and performance. Liquidity regards the number of shares exchanged daily. High liquidity is necessary to guarantee you can enter and exit the market timely and with ease.
Cost can be an important factor when investing for the long term. Although most ETFs have very low management fees, they still add up over longer investment periods. Finally, performance should be at least as good as the benchmark and preferably higher when compared to the ETF’s peers.
ETF Returns Ranked by Best 1-Month Return
1. Invesco S&P Small Cap 600 Pure Value ETF (NYSEArca: RZV)
This ETF tracks the S&P 600 Small Cap Index. This index has inclusion criteria that mean companies must satisfy a set of liquidity and financial viability factors to be included in the index. The index has had a return of 12.2 percent over the past month, outperforming its benchmark by 4.6 percent.
This small cap value ETF is rather on the smaller side when compared to some of the others managing billions of dollars. It also has a rather lower trading volume, just over 12 thousand shares daily. However, it has performed well over the past month, beating all its peers.
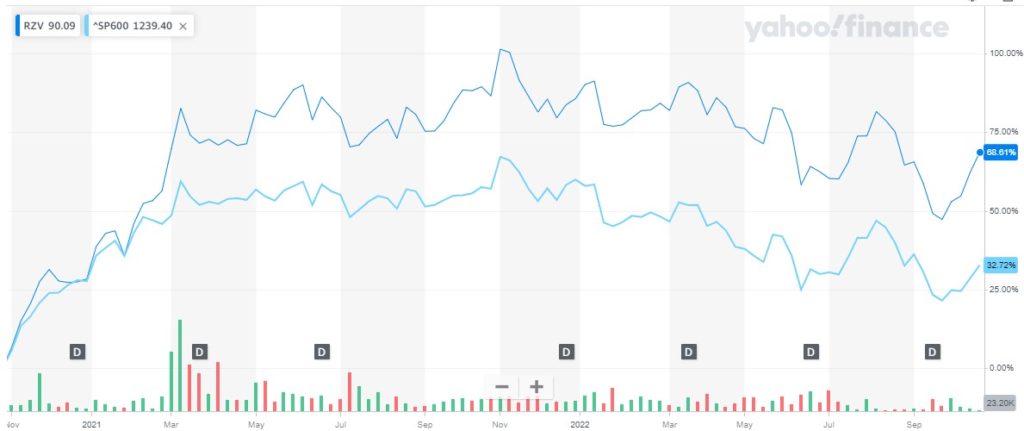
That may be due to its high Beta, at 1.42, which may magnify positive returns but also losses. Over the past 5 years, it has underperformed its benchmark. Although it has fared well against its peers over the same period.
- Net Assets: $235 million
- Expense Ratio: 0.35%
- Beta: 1.42
- Average Daily Volume: 12,485 shares
- Inception Date: 2006-03-01
- Benchmark: S&P 600 Small Cap Index
2. Avantis U.S. Small Cap Value ETF (NYSEArca: AVUV)
The Avantis US Small Cap Value ETF invests in a broad range of small cap companies that the managers believe can increase expected returns. The companies included in the ETF, they believe, have low valuations and higher profitability ratios.
The ETF is well funded with $3.37 billion in assets under management. Thanks to the size of the fund the number of shares traded is quite high at an average of over 897 thousand daily. This kind of number guarantees a substantial amount of liquidity.
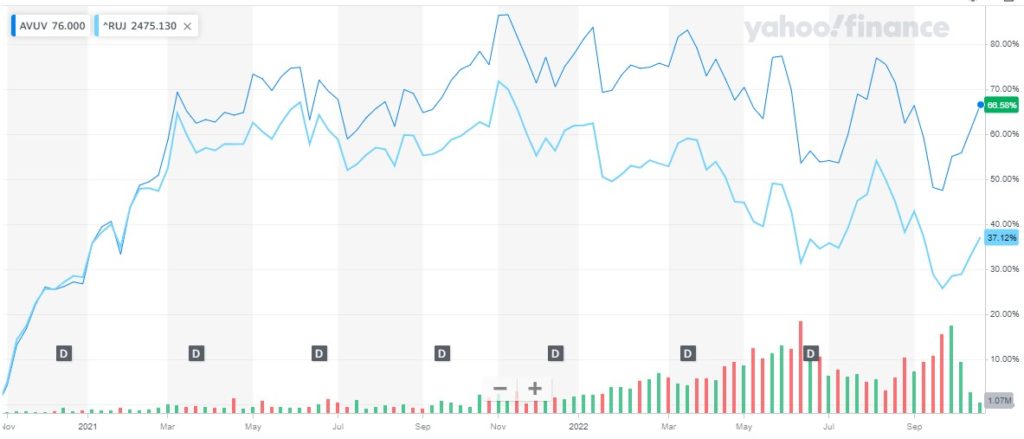
AVUV is second on the list for its 1-month performance, and over the past 3 years has outperformed its benchmark by 28.78 percent. And has also outperformed almost all of its peers over that period. While YTD it’s the fund that has given up the smallest return, losing 6.9 percent.
- Net Assets: $3.37 billion
- Expense Ratio: 0.25%
- Beta: 1.28
- Average Daily Volume: 897,471 shares
- Inception date: 2019-09-24
- Benchmark: Russell 2000 Index
3. Dimensional U.S. Targeted Value ETF (NYSEArca: DFAT)
This fund started as a mutual fund in 1998, and in June 2021, converted to an ETF with a listing on the NYSE Arca. DFAT invests in a wide variety of equity and fixed-income securities. It currently holds 1,612 different companies in its portfolio.
The fund also invests in REITs, and currently holds 7.78 percent in these securities. The largest holding for the fund is in the financial sector with an allocation of 28.67 percent. The fund has a considerable asset size with $7 billion under management.
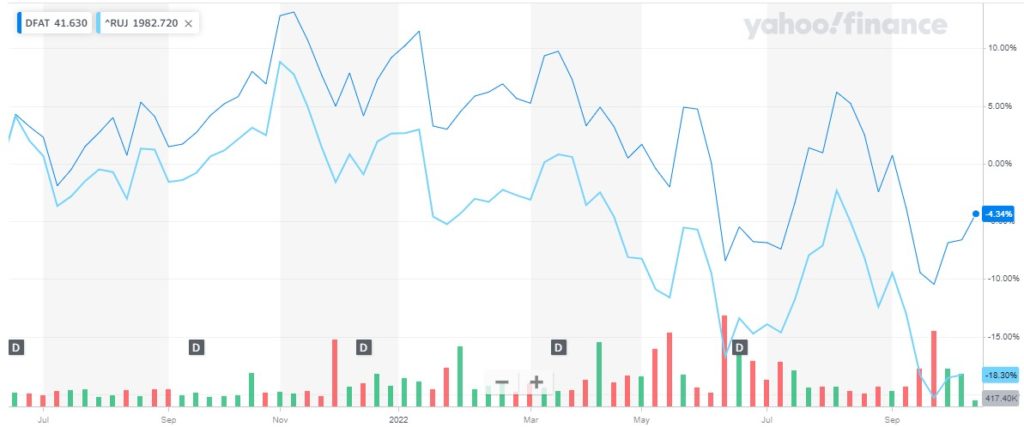
The Beta for DFAT is closer to 1 than the previous two ETFs on the list. Which means returns are less likely to be so volatile. The daily average trading volume is healthy at over 335 thousand shares.
- Net Assets: $7 billion
- Expense Ratio: 0.29%
- Beta: 1.14
- Average Daily Volume: 335,292 shares
- Inception Date: 1998-12-11
- Benchmark: Russell 2000 Index
4. Invesco S&P Small Cap Value with Momentum ETF (NYSEArca: XSVM)
This ETF invests in a subsector of the S&P 600 Small Cap Index, more specifically the S&P Small Cap High Momentum Value Index. The index has 120 constituents of the broader S&P 600, which are selected as having the highest value and momentum score according to the index methodology.
Holdings are weighted according to their scores, and the portfolio is rebalanced every six months. The fund is not one of the largest with $587.5 million of assets but is traded frequently. The average daily trading volume is over 110 thousand shares.
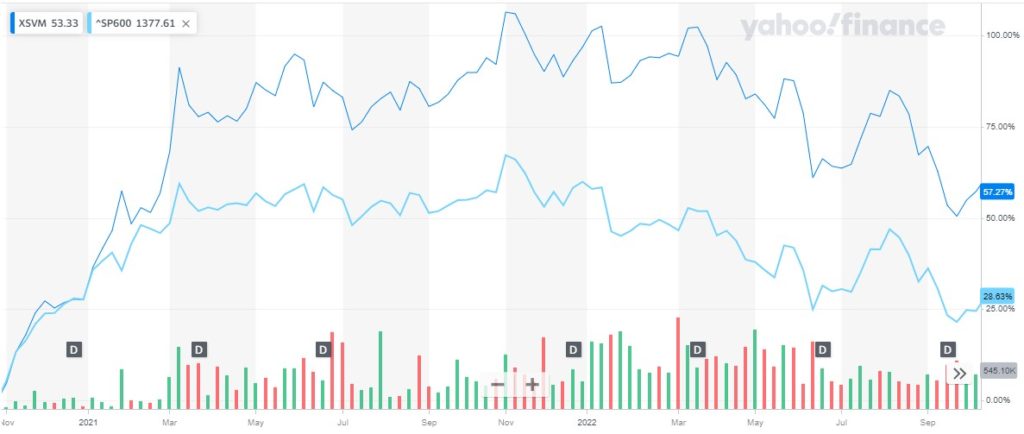
XSVM has outperformed all its peers over the period of 5 years having a total return of 52.37 percent. It outperformed its benchmark over the period by 39.61 as you can see from the table.
- Net Assets: $587.5 million
- Expense Ratio: 0.36%
- Beta: 1.23
- Average Daily Volume: 110,353 shares
- Inception Date: 2005-03-03
- Benchmark: S&P 600 Small Cap Index
5. SPDR S&P 600 Small Cap Value ETF (NYSEArca: SLYV)
This fund offered by State Street Global Advisors has the objective of closely tracking the performance of the S&P 600 Small Cap Value Index. With a Beta very close to 1 it seems that is likely the case.The fund has returned 12.8 percent over 5 years, which is very similar to the S&P 600 index return of 12.76 percent. However, over the past month, this ETF has returned 8.40 percent and ranks 4th on that basis.
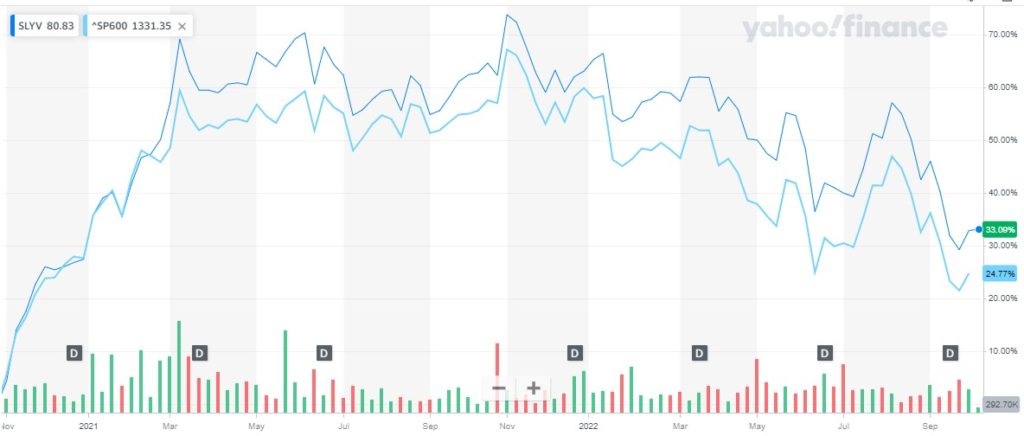
SLYV has a decent size of assets under management and a lower-than-average expense fee of 0.15 percent. The number of average daily traded shares is robust at over 231 thousand.
- Net Assets: $3.52 billion
- Expense Ratio: 0.15%
- Beta: 1.11
- Average Daily Volume: 231,546 shares
- Inception Date: 2000-09-25
- Benchmark: S&P 600 Small Cap Index
This small cap value ETF offered by Blackrock invests in small cap stocks that the managers see as undervalued relative to comparable companies.
Considering the benchmark the fund is targeting, they have managed to underperform it over the past 5 years. The total return for IJS is 17.85 percent compared to 26.95 percent for the benchmark.
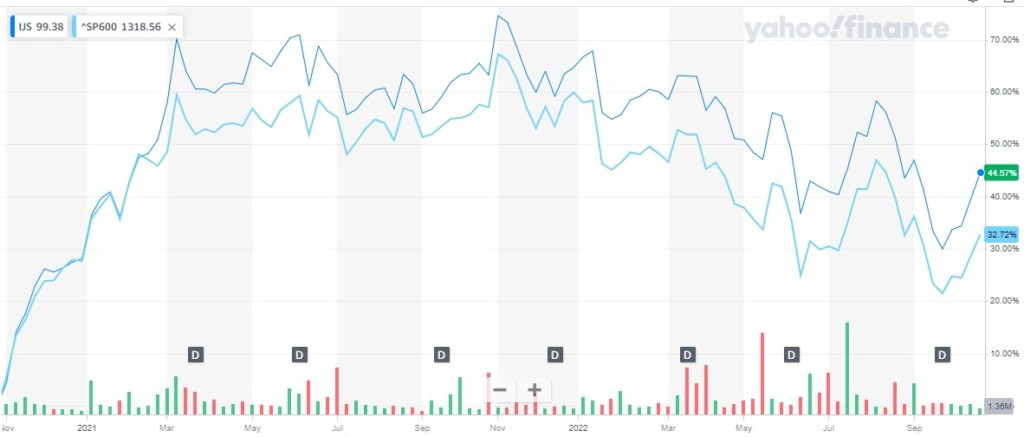
The ETF is well funded with $5.99 billion in assets under management and has a high amount of liquidity with over 588 thousand shares traded daily on average.
- Net Assets: $5.99 billion
- Expense Ratio: 0.18%
- Beta: 1.11
- Average Daily Volume: 588,190 shares
- Inception Date: 2010-09-07
- Benchmark: S&P 600 Small Cap Index
7. Vanguard S&P Small Cap 600 Value Index ETF (NYSEArca: VIOV)
This Vanguard small cap value ETF invests in the companies that compose the S&P 600 Small Value Cap Index. The fund's objective is to closely track the index's returns, less fees. The fund currently holds 467 stocks out of the 601 stocks in the index.
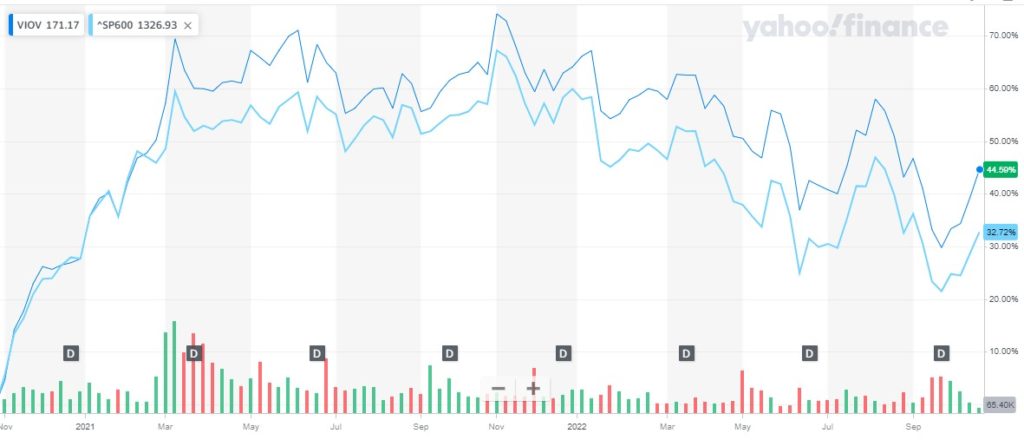
The fund has underperformed slightly the S&P 600 index over the past 5 years, with a total return of 21.95 percent compared to 26.95 percent for the benchmark. However, YTD the fund is managing to reduce the losses of the index. Where VIOV has dropped 12.5 percent compared to a drop of 17 percent for the S&P 600 index.
- Net Assets: $1.11 billion
- Expense Ratio: 0.15%
- Beta: 1.11
- Average Daily Volume: 42,289 shares
- Inception Date: 2010-09-07
- Benchmark: S&P 600 Small Cap Index
Blackrock offers its small cap value ETF that tracks 250 companies with prominent value characteristics. Despite the reduced sphere of stock selection, their prospectus states their benchmark as the Russell 2000 Value Index.
The fund is relatively new, with an inception date of October 2020, so there is no data for long-term performance. However, the ETF has managed to outperform both benchmarks, YTD, and over the past month.
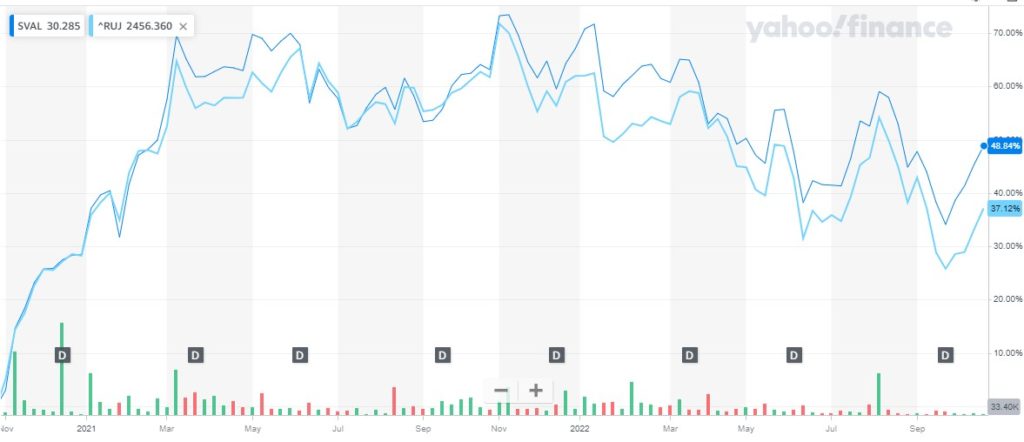
The ETF is on the smaller side of the industry average, at $122.6 million, and only has a daily traded average of just over 34 thousand shares.
- Net Assets: $122.6 million
- Expense Ratio: 0.30%
- Beta: 0.00
- Average Daily Volume: 34,406 shares
- Inception Date: 2020-10-27
- Benchmark: Russell 2000 Index
9. Vanguard Small Cap Value Index ETF (NYSEArca: VBR)
This fund by Vanguard tracks the return of the CRSP US Small Cap Value Index. We find the composition of this index similar to the Russell 2000 Value Index and for ease of use are using the latter as a benchmark.
The fund's objective is to passively manage the portfolio to match the returns of the above-mentioned index. The fund currently holds 880 stocks yet manages to keep a low beta of 1.13. The fund has outperformed its benchmark over the past 5 years returning 21.09 percent compared to 12.76 percent for the Russell 2000 Value Index.
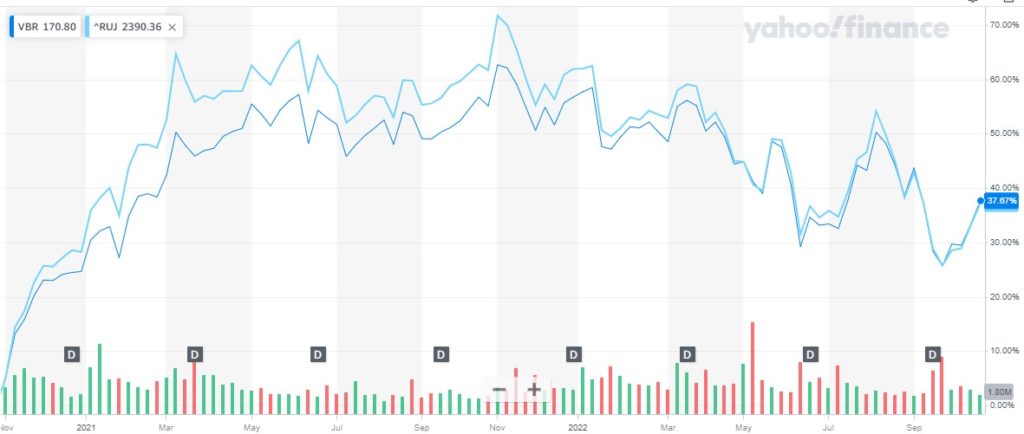
VBR is the largest ETF on the list and can provide a large amount of liquidity with an average of over 500 thousand shares traded daily. The ETF also has one of the lowest management fees on the list and in the industry, with an expense ratio of 0.07 percent.
- Net Assets: $40.7 billion
- Expense Ratio: 0.07%
- Beta: 1.13
- Average Daily Volume: 502,740
- Inception Date: 2004-01-26
- Benchmark: Russell 2000 Index
Blackrock offers their iShares Morningstar Small Cap Value ETF with the lowest expense ratio we could find in this category. ISCV has a management fee of 0.06 percent. The fund’s objective is to match the return of small cap US equities.
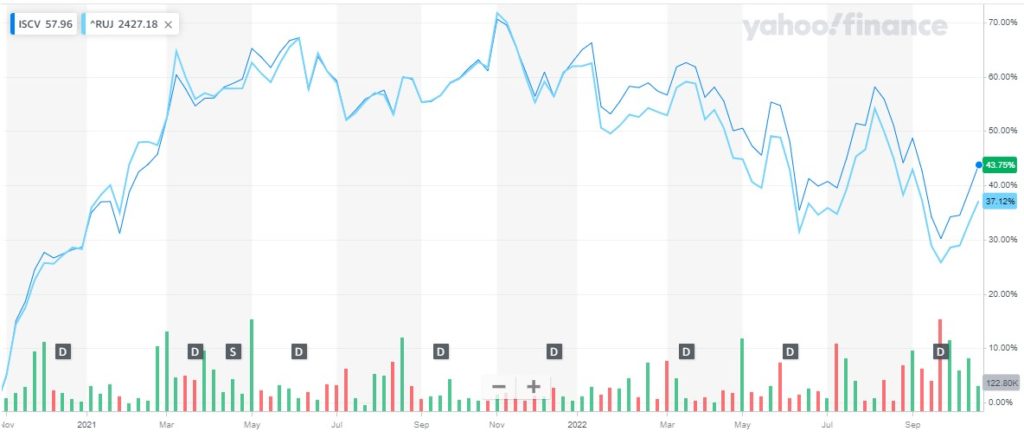
The fund tracks the Morningstar US Small Cap Broad Value Extended Index and currently holds 1,217 stocks from the index. Again, for ease of use, we have used the Russell 2000 Value Index as its benchmark.
ISCV over the last 5 years has underperformed against the Russell 2000 Value Index. The ETF had a total return of 6.47 percent compared to 12.76 percent for the benchmark. However, it is performing slightly better YTD where it is down 12.1 percent compared to 15.3 percent for the benchmark.
- Net Assets: $341.9 million
- Expense Ratio: 0.06%
- Beta: 1.22
- Average Daily Volume: 39,321
- Inception Date: 2004-06-28
- Benchmark: Russell 2000 Index
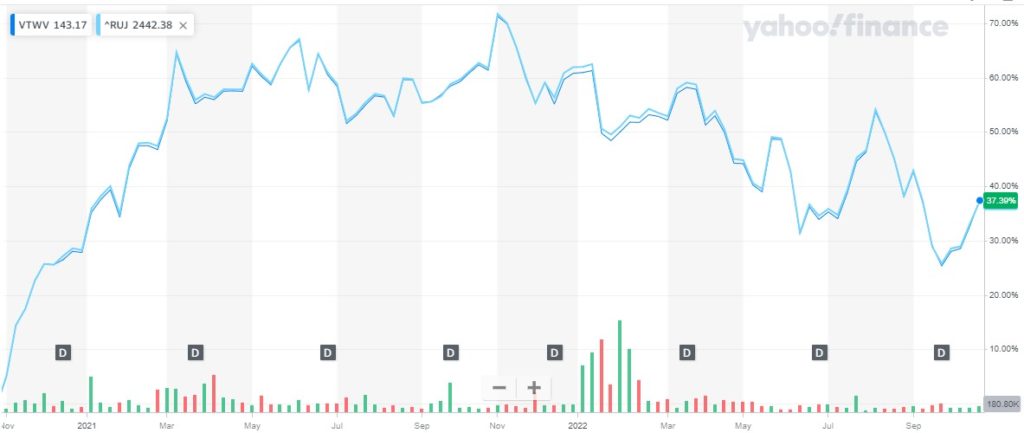
11. Vanguard Russell 2000 Value Index ETF (NASDAQ: VTWV)
Vanguard’s small value ETF, VTWV, closely follows the Russell 2000 Value Index. The objective of the fund is to invest in value stocks from the above-mentioned index. As we can see from the chart below, tracking VTWV against the Russell 2000 Value Index, it seems to follow the benchmark’s returns very closely.
Over the past 5 years, the benchmark had a return of 12.76 percent while VTWV has performed slightly better with a total return of 13.75%. While YTD the ETF is close to the benchmark’s performance having lost 15 percent compared to 15.3 percent for the index.
The fund has a lower than average management fee of 0.15 percent but a rather low level of liquidity with just over 34 thousand shares traded daily on average.
- Net Assets: $901.3 million
- Expense Ratio: 0.15%
- Beta: 1.13
- Average Daily Volume: 30,495
- Inception Date: 2010-09-20
- Benchmark: Russell 2000 Index
The fund’s objective is to track the returns on the Russell 2000 Value Index. These are small cap stocks that exhibit value characteristics. The ETF usually invests up to 80 percent of funds in stocks that compose the underlying index.
However, it may invest up to 20 percent in futures, options, swaps, and cash. The fund has $10.9 billion in assets which helps with liquidity. The daily average trading volume is over 1.2 million shares.
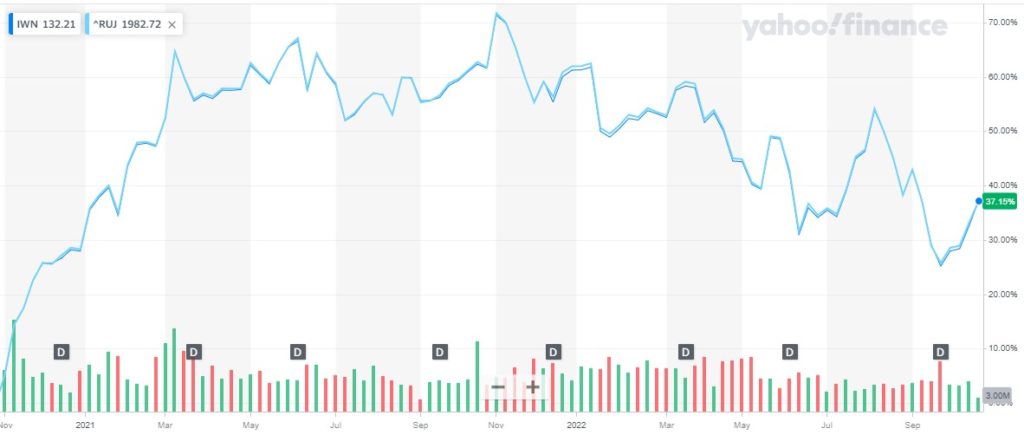
The fund seems to track the Russell 2000 Value Index very closely. The total 5-year return for IWN is 12.42% compared to 12.76% for the benchmark. While YTD the ETF is down 15.3 percent matching the index.
- Net Assets: $10.9 billion
- Expense Ratio: 0.23%
- Beta: 1.13
- Average Daily Volume: 1,217,242 shares
- Inception Date: 2000-07-24
- Benchmark: Russell 2000 Index
Conclusion
Allocating some of your portfolio to a small cap value ETF may be an effective way to diversify your stock holdings. However, you are still holding stocks. For a portfolio to be well diversified it should include assets that have little or no correlation to stock returns.
Given the current high inflation climate, it may be wise to hedge yourself against the negative effects of inflationary pressure. Many Americans do not consider what prolonged periods of high inflation can do to a traditional portfolio of stocks and bonds.
Sustained inflation with an economy that can’t keep up can lead to recession. But you can add physical assets like gold and other commodities such as copper to alleviate those market hocks which may occur.
Bottom Line
If you are thinking of adding ETFs, precious metals, or cryptocurrencies to your portfolio you may want to take advantage of a tax-enhanced environment. Retirement accounts such as self-directed IRAs or 401(k)s allow you to watch your investments grow tax-free.
Many companies out there offer their specialized services for crypto and precious metals investors. You can read our reviews on the top gold IRA companies here. We have also compiled an overview of the best crypto IRAs here.


 Gold: $4,665.63
 Silver: $72.57
 Platinum: $1,995.26
 Palladium: $1,511.13
 Bitcoin: $66,867.71
 Ethereum: $2,055.89