- GOLD IRA
- Download Our 2024 Precious Metals IRA Investor’s Guide.
Click Here
 Gold IRA
- Investing
-
- CRYPTO IRA
- PRICES & STATS
- RETIREMENT PLANS
 Questions? Call (888) 820 1042

 Silver
 Gold
Gold Platinum
 Palladium
 Bitcoin
 Ethereum
Spike in High Yield credit spreads
Disclosure: Our content does not constitute financial advice. Speak to your financial advisor. We may earn money from companies reviewed. Learn more
Last Updated on: 1st October 2015, 10:21 pm
Credit Spreads creeping up again
High Yield credit spreads are the difference in the cost of borrowing for low rated companies compared to the Government. Also more simply known as the Yield on so called Junk-Bonds, they act as an indicator of how the markets perceive risk. If the market is concerned that there may be hard times ahead, or that stock markets may become volatile and start heading south, then investors will be less likely to want to continue holding risky assets. Junk-Bonds as the name indicates are very risky, they are bonds with a rating below BBB- by S&P or Baa3 by Moody's. The speculative nature of these bonds means that they are highly sensitive to liquidity squeezes. If the market begins to feel that these types of assets are too risky then the simultaneous selling action of investors wishing to unload risky assets creates a sharp downward spiral in price and a rise in Yield or Credit spread.
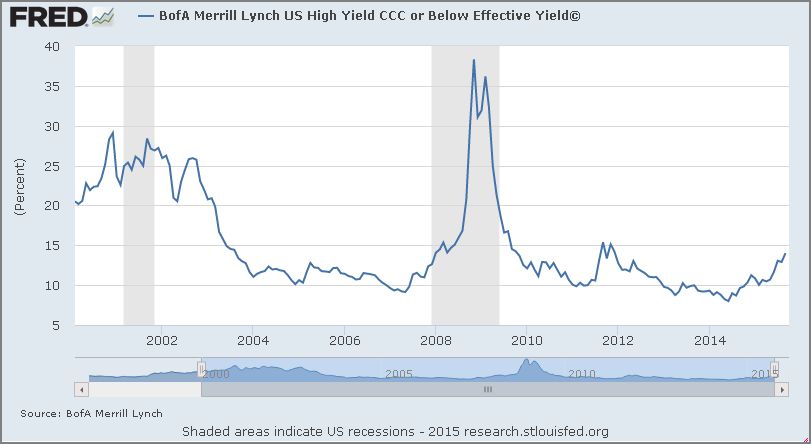
The chart below shows how High Yield bonds performed over the past 10 years. We can see how there are sharp increases in yield during the 2001 and 2008 crises. The spike in yield being considerably higher in 2008/2009 due to the severity of the crisis. As a recessive period sets in the yield in these bonds increases while the Fed Fund rate will decline as the Fed tries to stimulate the economy by lowering interest rates. Expansive monetary policy will also push interest rates lower in general. The Yield for speculative Bonds on September 30th was 14.22%, this type of level hasn't been seen 2011.
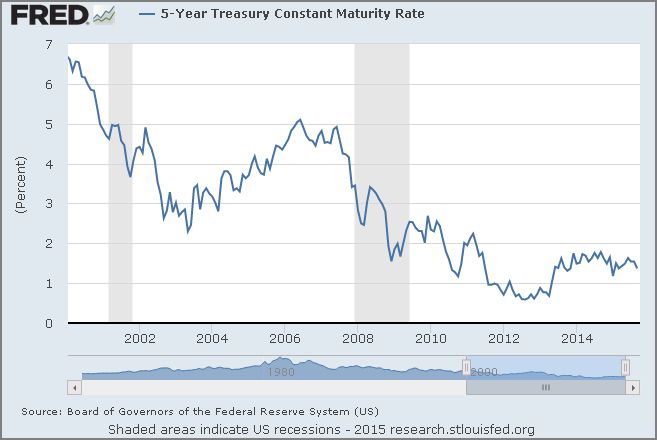
The yields of these bonds are of course also sensitive to overall levels of interest rates. This is why it is interesting to look at the spread, that is the yield over that of the risk free rate. As these Bonds are often of medium term maturity they are compared to Treasury Notes for the same maturity. From the chart below for the Yield on 5 year Treasury Notes we can see that yield fell during both the 2001 and the 2008 recession. Yet yields of speculative Bonds went up sharply due to investor's fear of risk during these periods.
What is driving Yields higher?
Bank of America Merill Lynch Indexes for Junk Bonds are showing these markets are set to post 4 successive months of losses, something not seen for more than 20 years. The weakness is coming mainly from the Energy sector, which is suffering enormously due to the rapid fall in commodity prices this year. In terms of price, Broad High Yield Bonds have lost 5%, but the energy sub-sector has lost close to 16% over the last quarter. The low prices in Crude Oil has spelt trouble for other sectors also, 5 sub-sectors of the High Yield index have had negative performance for the past 5 months. Such a poor generalized performance hasn't been seen since the 2008 crisis.
The spill over from low commodity prices is beginning to take its toll not only in the Energy sector. The demise of Glencore has already claimed another victim along the supply chain, a Japanese shipping industry giant. Daiichi Chuo KK filed for bankruptcy protection in Tokyo with approximately $ 1 billion in liabilities.
A faltering economy that has been trying to turn a recovery into expansion may be hindered by such low prices for commodities. The supply chain effects from the stress caused to companies involved in industry sectors highly dependant on high commodity prices is being felt in High Yield bond market. Moody's issues a Liquidity Stress Index which indicates the health of the High Yield Bond market, it currently stands at a five year high of 5.1%
General weakness
The global economy looks set for a slow down over the coming months, lead by China which is now the second largest economy in the world. That is unless another driving factor can change the current scenario. Europe at the moment is still struggling to get out of a long term recession. It now looks better than it did a few months ago, but it still may be another 2 or 3 years before Europe starts seeing the light at the end of the tunnel. Ultimately it would take a strong surge from the American economy to get the rest of the world back on track. That doesn't look like it is going to happen any time soon, latest ISM Manufacturing PMI data was released lower than expected and lower than previous data. Data coming from the US and China has been weak over the past 2 months putting pressure on stocks across the globe. The caution in buying stocks has been filtered through to other risky assets, and therefore we are seeing poor performance in speculative bonds. Investors are becoming weary to holding large proportions of risky assets in their portfolio at a time when the overall outlook is weak or not promising to say the least.


 Gold: $2,387.15
 Silver: $27.92
 Platinum: $931.02
 Palladium: $903.43
 Bitcoin: $67,910.26
 Ethereum: $3,278.81