- GOLD IRA
- Download Our 2024 Precious Metals IRA Investor’s Guide.
Click Here
 Gold IRA
- Investing
-
- CRYPTO IRA
- PRICES & STATS
- RETIREMENT PLANS
 Questions? Call (888) 820 1042

 Silver
 Gold
Gold Platinum
 Palladium
 Bitcoin
 Ethereum
S&P 500 still looking weaker despite strong jobs data
Disclosure: Our content does not constitute financial advice. Speak to your financial advisor. We may earn money from companies reviewed. Learn more
Strength of most recent rally subdued
Not all stock market rallies are made the same. Some have incredible momentum, with average daily gains well above 1% and many single day gains above 3%. A strong upward move in a broad index indicates the strength of a rally. In 2009, when the stock market reversed its downward trend, the S&P 500 averaged overall gains of 0.60% a day, up days averaged 1.21%. From the beginning of the rally on March 10, 2009, to June 2, 2009, there were also 7 days with gains of more than 3% plus another 8 days with gains above 2%.
Looking at the stock market’s most recent rally, the S&P 500 gained a remarkable 13.32% from its low on February 11 at 1829.08. The average gain during this period was 0.34% with an average up day of 0.54%. More notable is the fact that there were no days at all above 3%, and there was just one day above 2%. When compared to the rally that set off the 7-year bull market these numbers seem very lame.
There is strength in numbers
Like the adage states, the more the stronger and stock market bulls are very much of the same matter. Stock rallies should be accompanied by large surges in trading volume. When the market heads north just about everybody wants to get in on the action. Asset managers will begin to add to their positions with confidence, meaning they will not be buying some shares because they have to hold a minimum in stock, they are buying as many as possible.
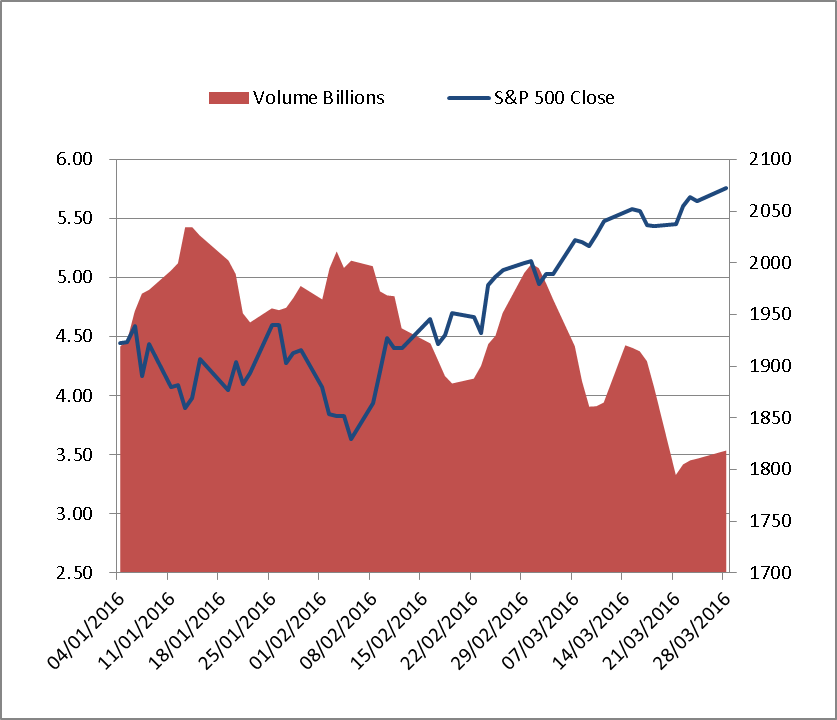
Looking at the S&P 500 trading volume of the period for the latest rally this year, mentioned above, average daily volume was 4.4 billion. That number is completely dwarfed when compared to the volume during the start of the latest long term bull trend in March 2009. The trading volume for the S&P 500 during the period from March 11 to June 2, 2009, was 6.8 billion shares.
The graph below shows how trading volume has actually shrunk as the market began to rally. The chart shows how the highest levels of trading volume have been reached while the market was trending down, whereas since the rally began, trading volume has actually shrunk. The reduction in trading volume tells us that as prices have increased there have also been fewer buyers. This may denote that the market does not completely believe in this rally.
Market view of Strength of the economy
Non-Farm Payrolls were released yesterday, and the figure was higher than expected at 215 thousand while forecasts had been for around 205 thousand. However, the S&P 500 did not react much; in fact, it edged lower dropping 7 points. That may sound contradictory, high job creation indicates a strong and expanding economy, just what a stock market needs. The problem here is that the Fed has stated that this metric is the main factor in deciding monetary policy. The markets deam that there is a risk that interest rate hikes may happen at too fast a pace and cause the economy to contract.
The stock market, therefore, needs to see that the economy is actually strong enough to withstand any further interest rate increases. Job creation alone does not necessarily suffice in keeping investors in the market. Yesterday the S&P 500 ended up on the day, but it took a much higher than expected manufacturing number to turn the tide. The S&P 500 gained 1.2% after its release to end the day up by 0.63%.
Fed Predictions and contradictions
Various members of the Federal Reserve System have been stating their views that the Fed has room to raise rates throughout the year. Some, such as Atlanta Fed President Dennis Lockhart, even went as far as saying that a rate hike could be on the books and feasible for April’s FOMC meeting. He has since been contradicted by Fed Chair Yellen at her last speech at the Economic Club in New York. Yellen stated there were reasons of global stability to be taken into account before proceeding with further hikes. Overall her message was a dovish one, starkly contradicting hawkish comments from others within the Fed, like Dennis Lockhart.
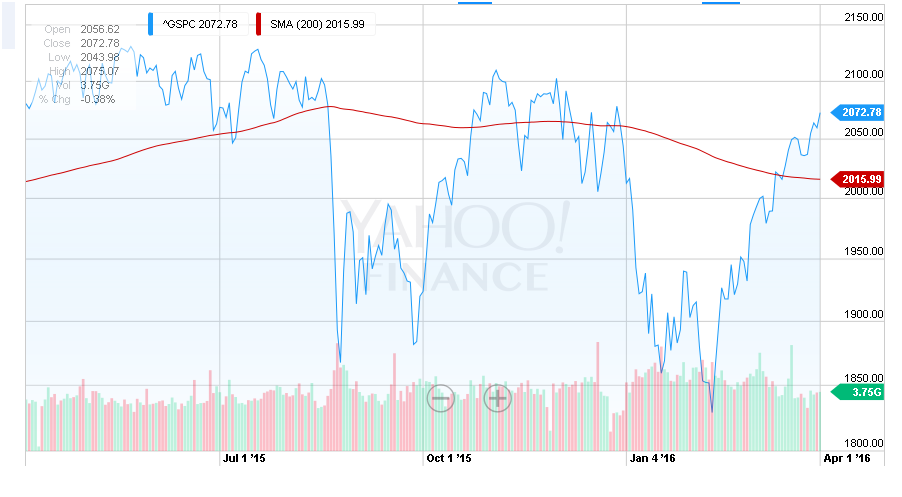
The Fed has been trying to convince everyone that the economy is on the right track, and it has the power to push an expansive monetary policy which can guide the economy back into full health. This however, may not be completely true. Inflation targets for the Fed do not seem to match those of the market; hence, 10-year Treasury yield is still nice and low at 1.774%. Despite the hike in rates in December, the yield on 10-year Notes has been in constant decline since its most recent high at 2.49% on June 22, 2015. As bond yields do not seem to show an economy about to over-heat, it seems reasonable then that the markets view any talk of accelerating monetary policy back to pre-crisis levels with a lot of concern.


 Gold: $2,387.15
 Silver: $27.92
 Platinum: $931.02
 Palladium: $903.43
 Bitcoin: $67,910.26
 Ethereum: $3,278.81