- GOLD IRA
- Download Our 2024 Precious Metals IRA Investor’s Guide.
Click Here
 Gold IRA
- Investing
-
- CRYPTO IRA
- PRICES & STATS
- RETIREMENT PLANS
 Questions? Call (888) 820 1042

 Silver
 Gold
Gold Platinum
 Palladium
 Bitcoin
 Ethereum
9 Reasons We’re Headed for a Stock Market Crash
Disclosure: Our content does not constitute financial advice. Speak to your financial advisor. We may earn money from companies reviewed. Learn more
Last Updated on: 21st December 2013, 08:41 pm
Emboldened by the Fed’s “loose money” policy and only mildly concerned about tapering, unsuspecting US investors are about to get hammered by a stock market crash. Here’s why…
1) Bubble Stocks
Investment-research firm Value Line recently reported that there's less value in the market today than there was in 2000 or 2007.
In fact, the median P/E ratio of S&P 500 stocks is at the highest level in 15 years, as there are many individual stocks that are trading at ridiculous multiples.
Take Amazon (AMZN)…
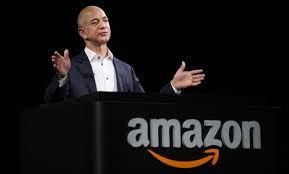
In the last nine months AMZN had $48.6 billion in sales, but only earned $34 million in profits. That’s less than 0.1% net profit margin!
These margins are worse than low-margin industries like the airlines which always seem to be going into bankruptcy. And yet AMZN has a market cap of $178 billion, and trades at 5,200 times this year’s earnings.
The last time AMZN got this expensive was back in 2000, and by 2003 it lost -90% of its value.
Or how about LinkedIn (LNKD)…
LinkedIn (LNKD) is the “Facebook for professionals”, and it sports an even heftier valuation than Facebook. In fact, LNKD sells for 19 times sales. That’s sales, not earnings.
It actually lost money in the last year, so it has no earnings. And yet the market has rewarded LNKD with a $27 billion market cap.
Right now there are many other “story stocks” like these, and it’s reminiscent of when internet stocks peaked in 2000.
2) Margin Debt
Margin debt is “hot money” that’s borrowed in order to speculate in stocks. Currently margin debt is near all-time high levels at over $400 billion. High margin debt levels are indicative of overconfident investors and almost always coincide with market tops.
The amount borrowed against stocks to buy stocks is now equal to more than 25% of the entire commercial and industrial loans in the U.S. This is an accident waiting to happen.
As you can see in the graph above, the peak of margin debt coincided with the peak in stock prices in 2000 and 2007, where stocks proceeded to sell off more than -50%.
3) Mortgage Applications Hit a 12 Year Low
With interest rates so low, you’d think that people would be borrowing money left and right to buy a home. But mortgage applications for November just hit a 12 year low, and since housing is such a large part of our economy this is a sign that the economy is slowing despite obscene amounts of Fed stimulus.
4) Highest % Dividend Payouts Since 1999
High dividend payouts mean that companies are returning a lot of money to shareholders – that’s good. But the downside is that it also means that companies are having trouble raising their dividends by growing their businesses. In other words, in order to raise their dividends they have to give more of their earnings back because they can’t come up with ways to make more money.
5) Stock Buybacks Highest Since 2007
You’d think that a high level of stock buybacks are good. You’d be wrong. When a wide swath of companies are buying back their own stock, it’s a bad sign because CEO’s are horrible asset allocators.
There’s a reason why 80% of all mergers and acquisitions fail – it’s because corporate executives stink at investing, especially when it’s not their personal money.
So if CEO’s don’t know how to get a good deal when buying another company, don’t expect them to get a good deal when buying shares in their own company either.
6) Investor Sentiment
Last week, the percentage of investment advisors reporting themselves “bearish” on the market fell to just 14.3% of the Value Line survey – the lowest level seen in the last 25 years.
The only other time when stocks were this expensive and there were so few professional bears was January 1973 – before the market fell 50%.
The only years when sentiment was this overwhelmingly bullish and stocks were almost this expensive were: 1972, 1987, and 2007. Those were all market tops, by the way.
7) Fed Balance Sheet Leveraged 65 to 1
The Federal Reserve is now utilizing more leverage than Lehman Brothers (30 to 1) and Bear Stearns (50 to 1) before they blew up. Need I say more?
8) High Yield Bonds Below 5% for the first time since 1987.
The fact that investors are willing to accept record low rates of interest from companies with dubious balance sheets says that they’re overreaching.
The last time this happened was 1987 – a memorable year because there was a single day where the stock market lost -25%. Just like back then, today’s investors are willing to take on way too much risk for such little returns.
9) Largest Number of IPO’s Since 2000
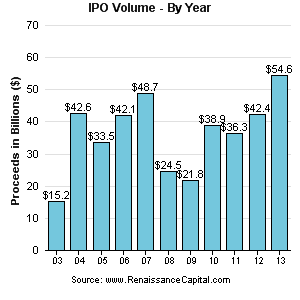 Let’s be clear, insiders do not sell their own stock at cheap prices. When there are a large number of companies clamoring to sell their stock, it speaks volumes about relative valuation.
The IPO market has been on fire in 2013, and there are a huge number of IPO’s in the pipeline for 2014. The last time there were this many IPO’s was in 2000.
What to Do With Your Assets
Right now is one of the worst times to buy stocks that I’ve ever seen. With the help of Fed funny money, our markets will display the extreme volatility that’s typical of third-world countries.
It’s time to raise cash, and take positions in gold, silver, and short term assets. Be patient, there will be some once-in-a-lifetime buying opportunities coming our way in a year or two.


 Gold: $2,387.15
 Silver: $27.92
 Platinum: $931.67
 Palladium: $903.43
 Bitcoin: $67,909.13
 Ethereum: $3,254.68