
 Silver
 Gold
Gold Platinum
 Palladium
 Bitcoin
 Ethereum
Survey of 2,000 U.S. adults (35–64): 38.6% bought gold or silver in the last 12 months; millennials lead; 91.7% of buyers say they’re equally/more likely to buy again.
Disclosure: We are reader-supported. If you purchase from a link on our site, we may earn a commission. Learn more
Last Updated on: 5th January 2026, 09:23 pm
2026 Survey Results • Gold IRA Guide
We surveyed 2,000 U.S. adults ages 35–64 to understand what is driving (and holding back) real-world precious metals investing heading into 2026.
Note: Findings reflect U.S. adults ages 35–64 (not all Americans). Percentages are self-reported and collected online; some questions allowed multiple selections.
Disclosure: This page summarizes original survey results for informational purposes only. It is not financial, tax, or legal advice. Investing involves risk, and outcomes vary. If you want help interpreting options for your situation, consider speaking with a qualified professional.
Executive summary
This survey suggests precious metals participation is higher than many people assume. Buying skews strongly toward millennials (35–44) and men, and most buyers report momentum (they expect to buy again). For non-buyers, the biggest unlocks are practical: pricing, trusted recommendations, and clearer education on how gold and silver investing works.
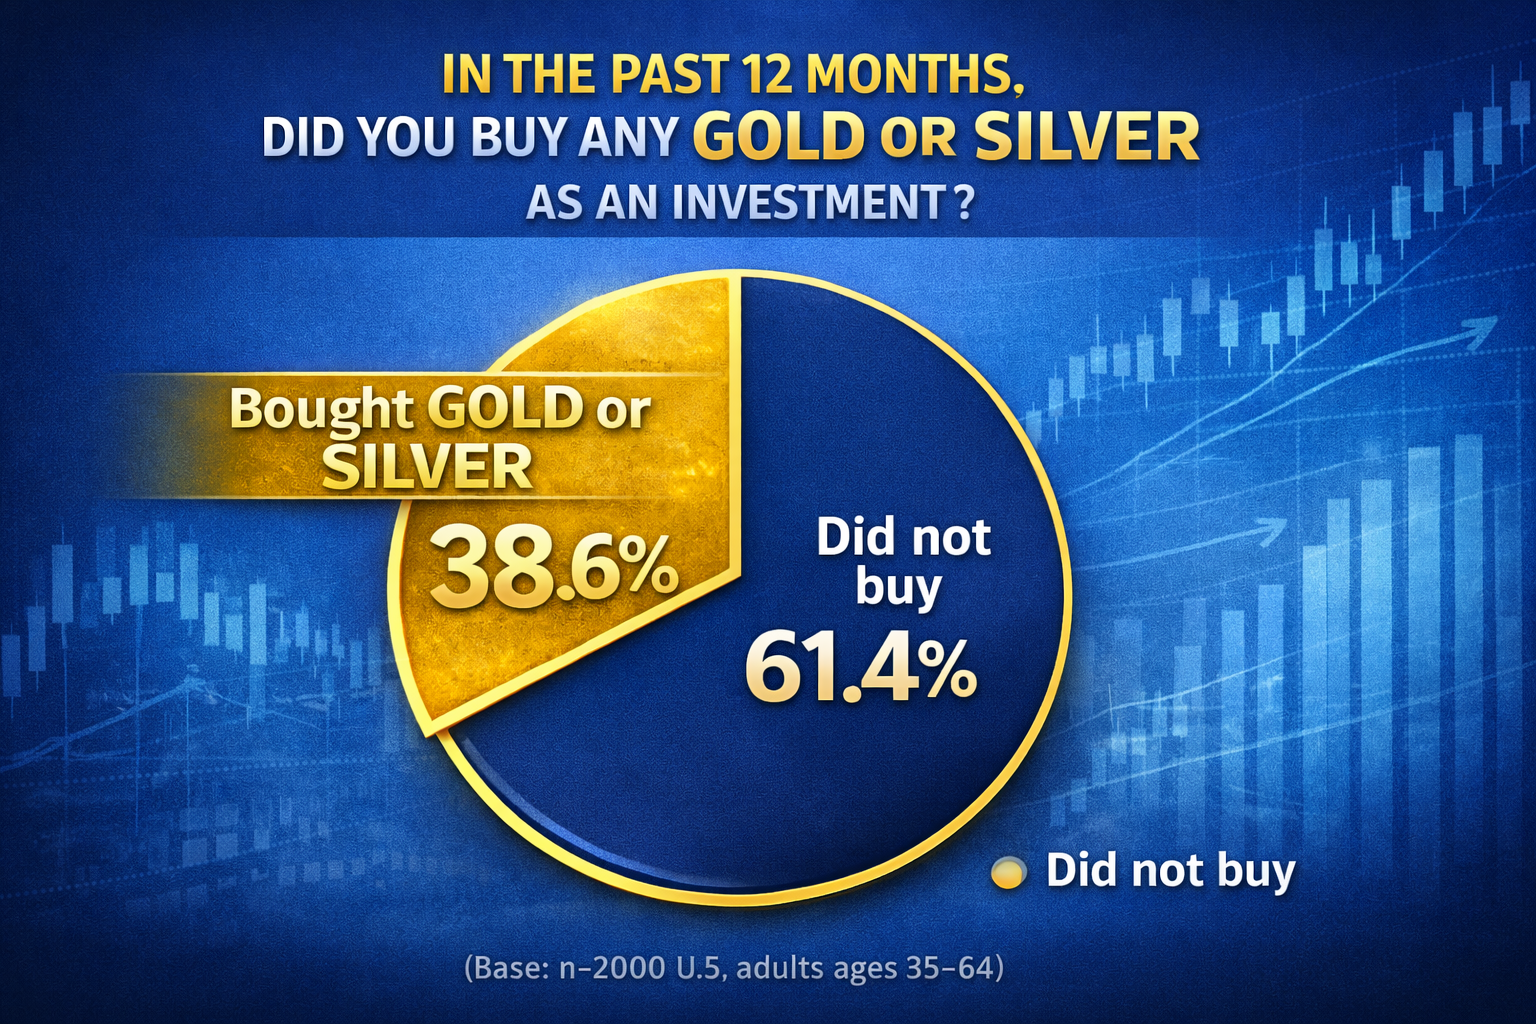
- 38.6% of U.S. adults ages 35–64 said they bought gold or silver as an investment in the last 12 months (n=2000).
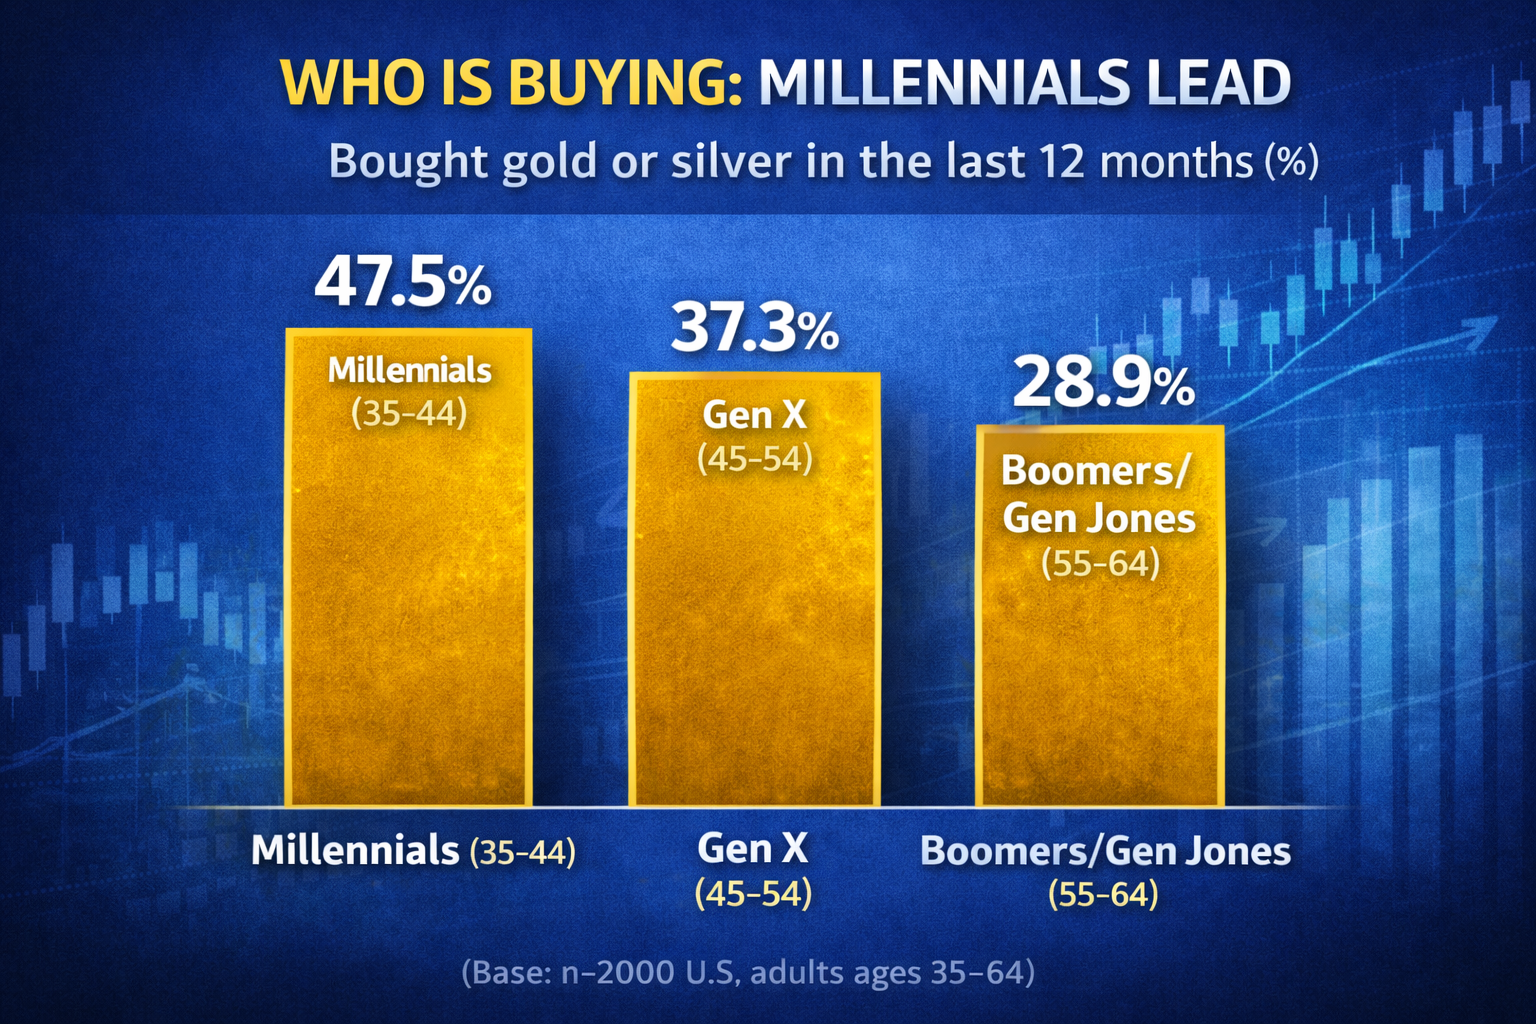
- Millennials (35–44) were the most active buyers (47.5%) vs ages 45–54 at 37.3% and ages 55–64 at 28.9%.
- Men reported far higher participation (50.6%) than women (27.0%).
- Among recent buyers, the most common path was physical coins/bars (61.9%), followed by an IRA route (including Gold/Silver IRAs) (34.8%). If you’re new to the IRA side, see our explainer on a IRA rollover page.
- Among recent buyers, 91.7% said they are equally likely or more likely to buy again in the next 12 months (48.2% more likely, 43.5% equally likely).
- Among non-buyers, the top friction point was I don’t have enough money/spare cash right now (53.6%).
- The top trigger that could pull non-buyers in was a gold/silver price drop (39.3%). Other common unlocks were a trusted recommendation or better education (36.8%) and lower fees/premiums with clearer pricing on metals (26.3%). For context on recent moves and long-term history, see gold price data.
- Non-buyers said they would most trust independent financial advisors (40.8%) and financial news outlets (34.0%).
Survey Methodology
- Fielded: January 2, 2026 (online)
- Sample: n=2000 U.S. adults ages 35–64
- Geography: Respondents across all U.S. states plus D.C.
- Margin of error: approximately ±2.2% at the 95% confidence level (full sample; subgroup MOE is larger)
- Notes: Some questions allowed multiple responses; those charts are labeled accordingly.
- Source: Gold IRA Guide commissionned a Pollfish™ online study
- Weighting: Pollfish provided post-stratification weights (range: 0.82–1.16; mean ≈ 1.00). Results on this page are shown unweighted unless noted. Applying weights yields a very similar topline for Q1 (38.1% weighted vs 38.6% unweighted).
For journalists: If you’d like the full downloadable and filterable report (including crosstabs and question wording), email info@goldiraguide.org.
Full survey questionnaire (question wording and response options)
Below is the questionnaire as presented to respondents (U.S. adults ages 35–64). Some questions allowed multiple selections and are labeled accordingly.
- Yes
- No
- Physical coins or bars
- Through an IRA route (including Gold/Silver IRAs)
- Through an ETF/fund
- Mining stocks
- Gold only
- Silver only
- Both gold and silver
- Under $500
- $500–$2,000
- $2,000–$10,000
- $10,000–$50,000
- $50,000–$100,000
- $100,000+
- More likely
- Equally likely
- Less likely
- Not interested
- I don’t have enough money / spare cash right now
- I didn’t know where to buy it or who to trust
- I prefer other investments (stocks, bonds, ETFs, real estate, etc.)
- Gold/silver prices felt too high
- I’m not interested in gold and silver
- I prefer crypto (Bitcoin, etc.)
- Gold/silver price goes down
- I had a trusted recommendation or better education
- Lower fees/premiums and clearer pricing on metals
- US dollar weakens
- Inflation rises again
- Stock market drops
- Banking or debt crisis
- Major war or geopolitical crisis
- Independent financial advisors
- Financial news outlets (e.g., Wall Street Journal, Bloomberg)
- Investment research reports
- Precious metals dealers/brokers
- Academic studies/experts
- Government financial regulators
- Age (35–44, 45–54, 55–64)
- Gender
- Household income range
- U.S. state (including D.C.)
For journalists: Email info@goldiraguide.org for the full downloadable and filterable report.
Table of Contents
Survey's Topline Results
Before diving into the details of the survey, it’s worth anchoring on the headline result. In our survey, 38.6% of U.S. adults ages 35–64 said they bought gold or silver as an investment in the past 12 months. While that may sound high at first glance, it sits comfortably within the range reported by other large investor surveys over the past few years, and likely reflects the fact that 2025 was a breakout year for precious metals…
For context, a 2024 Bank of America survey found that roughly 45% of respondents said they own or invest in gold in some form, while a 2024 WGC study revealed that a staggering 85% of professional investors owned some form of gold in their portfolios. Importantly, those studies were limited to a smaller sample size, didn't include silver and were not limited to recent purchases, whereas our survey specifically captures buying activity during a single 12-month period, and asked our respondents about both gold and silver.
It’s also worth noting that how people interpret “investing in gold” varies. Some respondents include physical coins and bars, others include IRA-based exposure, and some may reasonably count higher-value gold jewelry as part of their investment behavior. Combined with gold’s strong performance, heightened inflation awareness, and growing interest from younger investors, these factors help explain why participation appears elevated in 2025 — particularly among millennials, who emerged as the most active buying cohort in our data.
Highlights that jumped out
How buyers are investing
Among people who bought in the last 12 months, physical bullion dominates, and IRA-based buying is a major channel as well. The practical takeaway is that “gold investing” is not one behavior: physical ownership, IRA-based exposure, ETFs/funds, and mining stocks each come with different tradeoffs.
Quick note: four different “gold exposures”, four different risk profiles
- Physical bullion is about direct ownership. Your main variables are premiums, liquidity, and storage/security. For risk education on physical precious metals, see FINRA’s investor guidance on physical precious metals.
- Gold or Silver IRAs add tax structure, but you also introduce custodians, depositories, and ongoing fees. If you want a neutral overview of how custodians fit into the process, see our IRA custodians page. For general IRA rules, the IRS covers basics in Publication 590-A: IRS Pub. 590-A (draft).
- ETFs/funds are convenient for brokerage accounts, but they can introduce structural and counterparty considerations.
- Mining stocks can be leveraged to the metal price, but they add business and operational risk.
Why non-buyers stayed on the sidelines
The “why not” answers matter as much as the “why.” If you run a business, think of this like conversion friction: people don’t avoid precious metals for one single reason. It’s usually a mix of budget, confidence, and competing priorities.
What would make them invest in the future
This is the most actionable section in the study. When we asked non-buyers what could change their mind, the top responses were practical: lower prices, trusted recommendations, and clearer education.
Who non-buyers trust
If you want to educate new investors, you need to meet them where their trust already lives. In this survey, independent financial advisors and established financial media lead the trust map. If you’re learning, it also helps to know what to watch out for: the FTC has warned consumers about “buy gold bars” scam pitches, and Investor.gov has general investor alerts on online and social-media fraud.
Helpful resources:
FTC consumer alert |
Investor.gov fraud alert
So what does this mean for gold investors
These survey results highlight two realities at once: (1) participation is broader than many people assume, as millenials now represent the most active group of buyers and (2) future demand for gold and silvber may be driven mostly by practical factors like price sensitivity and provider trust, not by inflation or geopolitical instability as many would assume. If you’re researching your options, it can help to first understand how this asset class works, what costs exist (including premiums on physical bullion and IRA-related fees), and what risks apply. Speaking to your financial advisor is always a good first step. For readers who want to explore gold providers at a high level, you can browse our updated directory of gold companies. If you’re unsure where you fit, you can also start with our neutral self-assessment: Should you buy gold? (quiz). As always, do your due diligence and speak to your financial advisor before making any investment decision.
Key findings (quick summary)
38.6% bought gold or silver38.6% of U.S. adults ages 35–64 reported buying gold or silver as an investment in the past 12 months
(n=2,000).
91.7% expect to buy againAmong buyers, 91.7% said they’re equally likely or more likely to buy again in the next 12 months
(n=771).
Millennials lead participationMillennials (35–44) reported the highest buying rate (47.5%) compared with ages 45–54 (37.3%) and 55–64 (28.9%).
Physical first, IRA is meaningfulAmong buyers, 61.9% bought physical coins/bars, and 34.8% bought via an IRA route
(multiple responses allowed).
Non-buyer friction + triggersAmong non-buyers, the most selected barrier was lack of spare cash (53.6%). Top-cited triggers were a price drop (39.3%),
a trusted recommendation or better education (36.8%), and lower fees/premiums with clearer pricing on metals (26.3%).
Note: Some questions allowed multiple selections; percentages for those items may sum to more than 100%.
About Gold IRA Guide
Gold IRA Guide is a research-first publication focused on precious metals investing and retirement planning. We publish educational guides, data-driven analysis, and practical tools to help readers make better decisions under uncertainty.


 Gold: $4,749.38
 Silver: $75.94
 Platinum: $2,050.08
 Palladium: $1,516.04
 Bitcoin: $71,765.33
 Ethereum: $2,218.66