Rising Unemployment Claims and Diverging Stock Sector Performance Renew Concerns
Disclosure: Our content does not constitute financial advice. Speak to your financial advisor. We may earn money from companies reviewed. Learn more

This past week saw unemployment claims for the week of Aug. 15th rising to above one million once again. Economists surveyed by the Dow Jones company had anticipated only 923,000 total claims. At the same time diverging stock sector performance revealed that the run up in S&P 500 stocks to record highs (from the February bottoms of the current ongoing economic crisis) has only positively impacted less than half of the stocks on the index. These two negative economic releases have again raised concerns for the state of the U.S. economy amid the ongoing fallout of the coronavirus pandemic.
Unemployment Claims Filings Top One Million Again
The numbers of Americans who filed for unemployment benefits the prior week turned out to be more than economists anticipated. This revived worries about the health of the American national economy even as Congressional lawmakers were unable to agree on another stimulus package to support unemployed workers at decades' high levels.
The U.S. Department of Labor reported that the week ending August 15th initial jobless claims tally amounted to 1.106 million. Dow Jones polled economists were looking for a result of 923,000 total claims. The prior week initial claims also saw a revision of 8,000 more to reach 971,000. It was the first week in 21 consecutive weeks in which the initial claims had amounted to under a million in total. Senior Economist Daniel Zhao of Glassdoor attempted to explain the statistics with:
“The modest jump is a stark reminder that claims will likely encounter some turbulence as they fall rather than gliding in for a soft landing.”
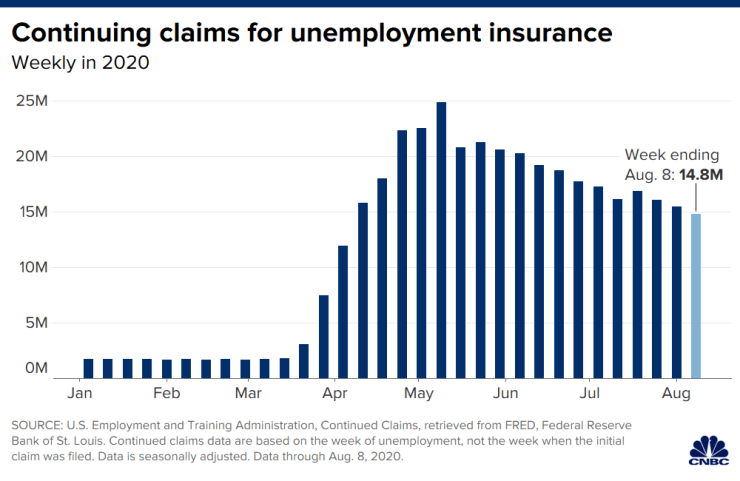
The continuing claims correlate to those American workers who have been obtaining unemployment benefits for minimally two consecutive weeks. This amount fell by a total of 636,000 to reach 14.844 million continuing claims during the week that ended August 8th. This data series on continuing claims has a delay of one week versus initial jobless claims. The chart below shows the weekly trend for continuing claims of unemployment:

For the breakdown on a state (and territory) level basis, the greatest surge in initial claims totals for the week that ended August 8th came from Nevada, Puerto Rico, and then Kansas. Nevada's initial claims increased by 4,028 as reported by the U.S. Department of Labor. Meanwhile the Puerto Rico totals spiked higher by 3,601, and Kansas revealed a rise of 2,248 claims.
Stock Sectors Diverging Reveals Another Under Discussed Economic Problem
This past Tuesday saw the S&P 500 close at an all-time high despite the continuing economic problems plaguing the United States' economy. On the surface, the losses incurred during the Covid-19 sell off appeared to have been erased with the broad index having once again reached levels seen before the pandemic erupted in the U.S.
The index high levels only presented a partial story though. Below the headlines of a thriving stock market is another reality that CNBC uncovered in more detailed analysis of the S&P levels. Their research revealed that most stocks in the index have not in fact returned to their past high levels. The market as a whole plunged and recovered to new levels from the last high of February 19th and the latest high reached on August 18th, but a mere 38 percent of the index listed stocks realized actual gains in this timeframe. The majority of S&P 500 stocks during that timeframe, the balance 68 percent, posted negative returns.
In fact in a high number of cases such stocks have fallen substantially from the levels they held back in February of 2020. It is the case that 43 stocks of the index were substantial winners that realized gains of at least 25 percent. The winners have been a handful of stocks such as technology and health care bellwethers Amazon, PayPal, and ABIOMED. Yet the numbers of major declining company stocks in this same time frame has been far greater.
One Quarter of S&P 500 Index Is Down Over 25 percent
A quarter of this S&P 500 index (126 stocks) realized major declines amounting to at least 25 percent versus their February 19th levels. Included in the severe losers list were top three decliners over that timeframe Norwegian Cruise Lines, Occidental Petroleum, and Carnival Corporation. CEO Michael Yoshikami from Destination Wealth Management explained about the alarming demand shift that has been underway with:
“It's not as if everything is rising. You pull money out of names that really aren't attractive given current conditions. And that money moves over to companies that are thriving in this environment.”
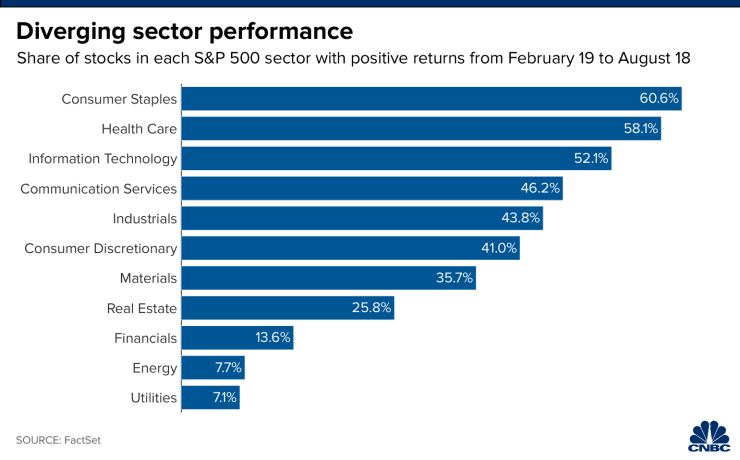
Without a doubt the stocks in certain sectors have outperformed other ones. In categories including health care, consumer staples, and information technology, over 50 percent of the stock issues realized gains in the time frame between February 19th and August 18th. Yet in other important economic categories such as utilities and energy, fewer than 10 percent of the stocks saw gains in that same period.
It is also noteworthy that the results have not been consistent within even specific sectors. The technology sector is a prime example of an area that has witnessed substantial valuation increases from the past high to this new high in the index. Technology stocks rose by 12 percent in this period of February 19th through August 18th and were a major driver in the market's unbelievable rally back. Yet even as some stocks such as Nvidia and PayPal jumped by over 50 percent, other important companies like Xerox and Western Digital plunged by the same amount.
Health care is another example where individual stock performance has not been impressive across the board. A few companies like Regeneron, West Pharmaceuticals, and Abiomed gained over 50 percent and emerged as leading performers in the index. At the same time, over 40 percent of stocks in the health care sector have dropped substantially, including Cigna, Universal Health Services, and Dentsply Sirona, each of which has fallen by between 18 percent and 26 percent.
This chart below depicts the differences in various sectors of the S&P 500 over the February 19th through August 18th time frame:

Dovish Fed and Easy Money Policies Have Been Underpinning Stock Market Records
There is also another reason that stocks have in general posted higher levels despite the continuing economic headwinds buffeting the U.S. economy. The Federal Reserve (which will meet for Powell to headline their annual Jackson Hole conference virtually this coming week) has flushed the U.S. economy and financial system with both incredibly easy money and lowered interest rates. Chief Investment Strategist Ed Keon of QMA predicted that more of the same is coming:
“I think we know the Fed's all in. If anything they want the mechanicals to work right. The basic Fed policy is crystal clear. You're going to have low rates for the foreseeable future. They will do whatever it takes.”
Unfortunately “whatever it takes” has not been enough so far to bring unemployment claims substantially and consistently down or to cover the ugly truth in the stock market that huge numbers of major publicly traded companies (not to mention private businesses that have already failed) are in financial trouble in the United States. Given the news this past week it is not hard to see why Gold makes sense in an IRA. You can get more information by reading about the top five offshore storage locations for your Gold IRA and the top five Gold coins for investors. It is always sensible to look at the top Gold IRA companies before making any decisions.


 Silver
 Gold
Gold Platinum
 Palladium
 Bitcoin
 Ethereum

 Gold: $2,623.07
 Silver: $29.51
 Platinum: $929.27
 Palladium: $917.22
 Bitcoin: $97,149.49
 Ethereum: $3,384.83