- GOLD IRA
- Download Our 2024 Precious Metals IRA Investor’s Guide.
Click Here  Gold IRA
 Investing
-
- CRYPTO IRA
- PRICES & STATS
- RETIREMENT PLANS
- BLOG
 Questions? Call (888) 820 1042
Best and Worst Performers in 2015; A Look at How Various Assets Performed
Disclosure: Our content does not constitute financial advice. Speak to your financial advisor. We may earn money from companies reviewed. Learn more
We are going to have a look at the best and worst performers of various asset classes from Stocks to Currencies and at their different sectors during 2015. I’m going to consider funds, at times, as they are a convenient vehicle for holding many types of assets. They are also more likely to be of interest to a wide range of investors. Not so long ago many types of assets were not accessible to the majority of investors, that has changed greatly since the introduction of ETFs.
Stocks
Stocks have not had a great performance in general at a global level. The Dow Jones Global Index lost 6.10% from the start of the year. Most major stock markets have performed poorly, including Switerzland down 1.35% and the UK down 5%. There have been some exceptions like the Argentine market; the MERVAL stock index gained 36.43%. Although that looks extremely attractive there is a small hitch, the Argentine Peso also lost 52.40% against the US dollar.
The domestic market has performed pretty much in line with the global index. Pressure from the possibility of a new cycle of increasing interest rates has stifled further gains in the stock market since the S&P 500 touched its high in May. The S&P 500 index returned -7.27% for the year. Other sectors of the stock market had similar performances; the Russell 2000 small Cap index lost 6.12%. The mid cap index S&P 400 however lost considerably less than its peers, ending the year down only 3.40%. One sector managed to give a positive return, the NASDAQ Composite had a 5.73% return in sharp contrast to other broad stock indices.
Real Estate
Real Estate has had a decent performance and depended greatly on sector and geographical location. Data from NCREIF shows that overall property prices at a national level grew by 3.27% annualized for the first 3 quarters of 2015. Western and Southern States saw the highest growth in prices with increases of 3.62% and 3.45% respectively for the first 3 quarters. When it comes to sectors the best performing property types where Retail and Industrial with increases of 3.67% and 3.64% for the first 3 quarters. While the slowest increase was for the Apartments sector, which saw prices grow by 2.92%. The Case Shiller US REIT index ended the year down by 1.36%. As this index measures publicly quoted REITs their price tends to act in a similar way to that of Stocks. The increase of interest rates may weigh on REITs' price performance. However these funds pay 90% of revenue to share holders to maintain their tax exemption, avoiding double taxation to the investor and fatter dividends.
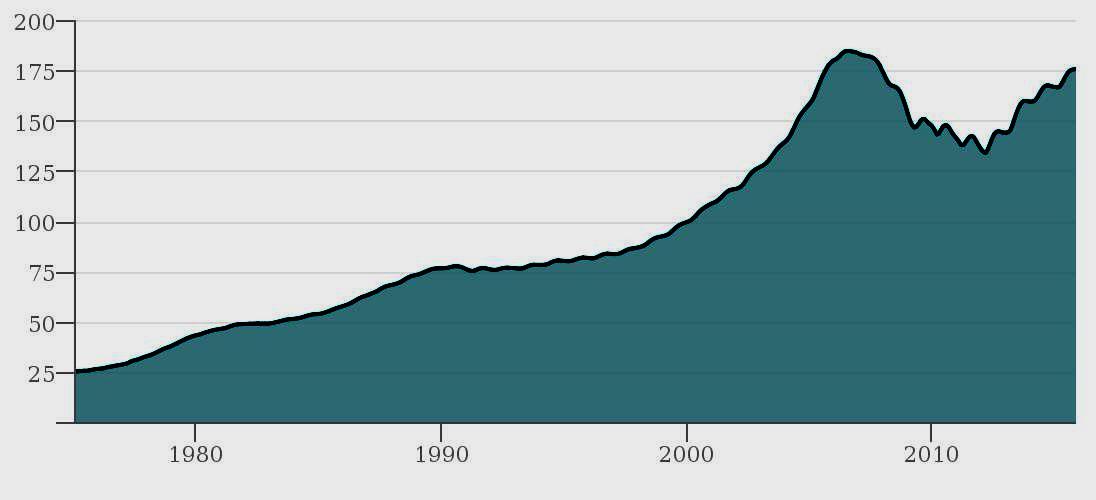
Case Shiller National Home Price Index

The chart above shows house prices nationwide have not caught up with price levels pre-2008 crisis. Although that won’t be the case for all parts of the country, as can be seen by the Case Shiller indices per city. The top performing cities are Denver and Dallas, where for both house prices are well above pre-2008 levels according to their indices. Denver ended 2015 with home prices 24.2% above pre-crisis levels and Dallas ended 2015 with home prices up 22.93% from pre-crisis levels. The worst performing city in the Case Shiller list was Phoenix, which ended 2015 with home prices still lagging pre-2008 levels by 31.65%
Commodities
Commodities took a large beating over 2015 with Crude Oil and Precious metals leading the way. Crude Oil saw increased supply and new oil fields, coupled with a weaker demand, drive WTI prices down by 27.40%. The excess supply does not seem to be likely to diminish any time soon. Congress has just voted to allow for exports of crude, OPEC does not seem in any haste to tighten the tap and Iranian oil may soon be back on the market. Gold lost roughly 10% over the last year and Silver around 11%. The other commodity that took a beating in 2015 was Wheat, the commodity tracking ETF WEAT:Arca lost 28.25% as its price went from $12.75 to $9.14
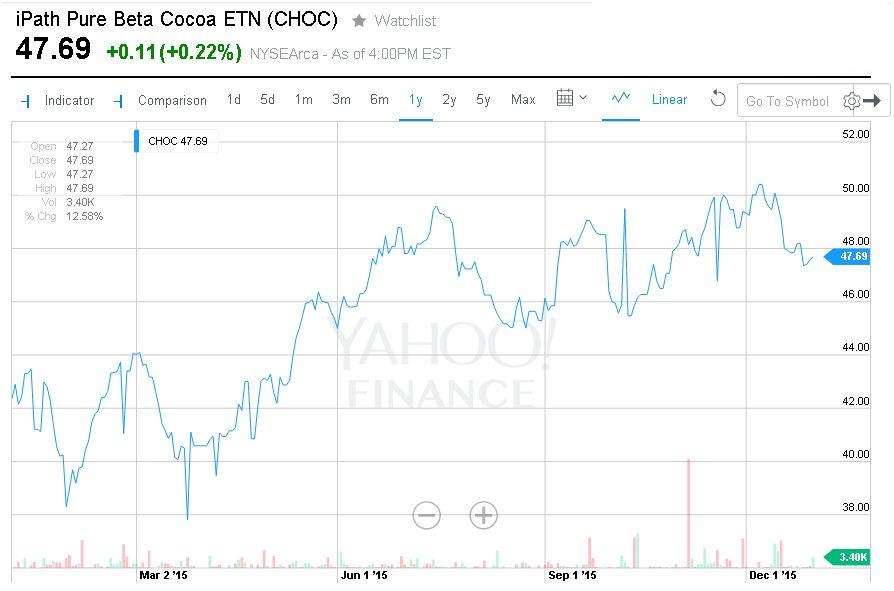
Two commodities however did exceptionally well compared to their peers, Cotton and Cocoa. Two commodity tracking ETFs; CHOC:Arca, surprising symbol for a Cocoa ETF and CTNN:Arca for cotton had gains of 12.58% and 8.27% for the year. Commodity prices may see a pick up in price if inflation begins to rise or if the US Dollar begins to weaken again. Most commodities are highly correlated to inflation, in fact they are often constituents of inflation baskets.
Currencies
The US Dollar has seen a major Bull run for most of 2015, in particular from the moment talk of higher interest rates began. The USD index (DXY) gained 8.60%; the basket is made up of major currencies. However it has performed better amongst certain currencies rather than others. In particular the Dollar has seen a strong performance against Emerging Market currencies. For example against the Argentine Peso as we saw earlier or the Brazilian Real where the USD increased by 47%. But it has also made some substantial gains against developed economy currencies; appreciating by 17.35% against the Canadian Dollar or gaining 10.21% against the Australian Dollar.
The strength in US Dollar looks set to continue as interest rates increase over the coming year. Economies that have slower growth or weak economies with lower interest rates will be particularly hit. Whereas commodity exporting countries may see their currencies gain some ground against the Dollar if commodity prices take a rebound next year.


 Silver
 Gold
Gold Platinum
 Palladium
 Bitcoin
 Ethereum


 Gold: $2,387.15
 Silver: $27.92
 Platinum: $931.02
 Palladium: $903.43
 Bitcoin: $67,910.26
 Ethereum: $3,278.81