
 Silver
 Gold
Gold Platinum
 Palladium
 Bitcoin
 Ethereum
Investing in Gold through a Thrift Savings Plan (TSP)
Disclosure: We are reader-supported. If you purchase from a link on our site, we may earn a commission. Learn more
Are you a federal employee or military member who participates in the Thrift Savings Plan? Have you ever wondered if you can invest in recession-proof physical gold or silver bullion (and other investment-grade metals) with your TSP? Here, we’ll go in details over TSP accounts, their investment limitations in regards to precious metals, and how you can safeguard your retirement assets against economic calamity.
Table of Contents
The Basics – What is a TSP Plan?
The United States government offers a unique type of defined contribution retirement plan to its employees and to members of the various branches of the armed services. Through the Federal Employees’ Retirement System Act of 1986 (FERS), Congress established the TSP as a 401(k)-style alternative to public workers. Technically speaking, the TSP forms one of the three parts of any FERS package, along with FERS annuities and Social Security.
Much like with a 401(k), employee participants in a TSP plan are able to defer money from their paychecks into a retirement investment account. There are even possibilities for match programs from the federal government. Once contributed, those assets are placed into the Thrift Savings Fund, which is managed by the Federal Retirement Thrift Investment Board. There are five executive members of this board, each of which is directly appointed by the President of the United States.
Employees or military members who contribute to a TSP account have very limited investment options, although they can mix and match between each option as they see fit. The Thrift Savings Fund is made up of ten investment funds, and the six most significant are called the G, F, C, S, I and L funds. These funds are created with mutual fund portfolios organized based on varying levels of risk. You cannot hold individual securities through the TSP.
Retirement savers who leave their federal post are eligible to either keep their money with the TSP (though they may not make any further contributions) or roll over their investments into another qualified employer plan or an IRA.
TSP Plan Rollover Rules & Limitations
If you have a TSP, you can perform a full withdrawal from your account once you leave federal service. Possible rollover destinations include an Individual Retirement Account (IRA), a 401(k) plan, or other select qualified plans. Here is an overview of some TSP rollover rules:
- When you receive funds from your TSP for a rollover, which can take several weeks from the time you submit your request, you have 60 days to complete the process. If you fail to do this, the IRS will treat your money as a taxable distribution.
- You cannot use the cash from your distribution to purchase investments in the period in between receiving your TSP distribution and establishing your IRA.
- Tax rules from TSP rollovers can be complicated, and you should consult a tax advisor prior to attempting a rollover.
It is advised that you select the option to perform a “direct rollover” with your TSP funds. In a direct rollover, you never receive a check for your distribution; rather, your TSP plan provider will transfer the money directly into you new IRA plan.
TSP Plan vs. 401(k) vs 457(b) vs Other Retirement Accounts
Here is a table that illustrates how a TSP account compares to other similar retirement vehicles.
| Plan Type | Sponsorship | 2025 Contribution Limit | Roth Option? | Allow Gold Stocks? | Allow Gold ETFs? | Allow Gold Bullion |
|---|---|---|---|---|---|---|
| 401(k) | Private Employer | $23,500 | Yes | Maybe | Maybe | No |
| Solo 401(k) | Self-employed | $70,000 | Yes | Yes | Yes | Yes |
| Keogh Plan | Self-employed or Unincorporated Employer | Depends on Type of Plan | No | Maybe | Maybe | No |
| 403(b) | Government or Non-profit Employer | $23,500 | Yes | Maybe | Maybe | No |
| 457(b) | Government or Tax-exempt Employer | $23,500 | Yes | Maybe | Maybe | No |
| SIMPLE IRA | Private Employer | $16,500 | Yes | Yes | Yes | Maybe |
| SEP IRA | Business Owners & Self-employed | $70,000 or 25% of Compensation | Yes | Yes | Yes | Maybe |
| Profit Sharing Plan | Private Employer | $70,000 or 100% of Compensation | No | Maybe | No | No |
| Money Purchase Plan | Private Employer | $70,000 or 25% of Compensation | No | Maybe | Maybe | No |
| Annuity | Individual | None | No | Maybe | Maybe | No |
| ESOP | Private Employer | Varies | Yes | Maybe | No | No |
| SARSEP | Private Employer | $70,000 or 25% of Compensation | No | Yes | Yes | Maybe |
| Traditional IRA | Individual | $7,000 / $8,000 | Yes | Yes | Yes | No |
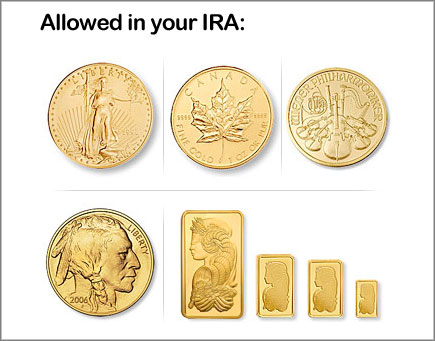
| Precious Metals IRA | Individual | $7,000 / $8,000 | Yes | Yes | Yes | Yes |
| Thrift Savings Plan (TSP) | Government or Military | $23,500 + $7,500 Catch-up Contribution | Yes | No | No | No |
(In this case, “Maybe” denotes that availability varies on a case-by-case basis. While some TSPs offer gold exposure in the form of stocks and mutual funds, some do not.)
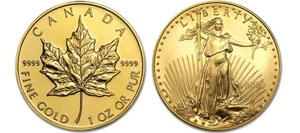
Types of Gold you can Invest in Through a TSP Plan
TSP accounts are limited to investing in the ten separate TSP funds only. Some of these funds directly track individual market indexes, while the others are called “lifecycle funds” that are made up of stock/bond splits that change as the investor ages. If you choose to not actively manage your account, 100% of your money will be placed towards the “G” fund.
In other words, it is impossible to invest in physical precious metals or any other type of real asset via a TSP. In fact, you cannot even directly purchase the stocks or mutual fund shares that hold stocks of gold mining companies (buying “paper gold”). Among possible retirement account options, TSPs are among the most restrictive and provide the least exposure to precious metals.
Differences Between Investing in Physical Gold vs. ‘Paper Gold’
Paper stocks refer to individual securities or equities that represent shares in precious metals mining or exploration companies. Holding these securities gives investors indirect exposure to the precious metals market. Some of the larger funds in the space include the Gold Miners Index (GDX) or the BUGS Index (HUI), which are both ETFs with diversified holdings in the sector.
Be warned, however, that these types of investments are convenient to buy and sell but pose a greater risk than physical bullion. Since they're listed on digital exchanges, they can be bought and sold instantaneously and therefore are more prone to erratic price swings than real assets. Unfortunately, that's not the only kind of unique risk they pose. Below, we've highlighted a few other risks of paper gold:
- Regulatory Risk – regulations surrounding the mining and exploration sector are fickle and are subject to change depending on political sentiments, which makes the industry highly unpredictable.
- Cost of Production Risk – it's expensive to mine gold or silver ore, and upgrades to equipment or fleet overhauls can cause a company to over-leverage and potentially go down the path toward bankruptcy.
- Management Risk – when a company is taken over, there's a lot of management risk involved since the new management team might not have practical industry experience and can therefore jeopardize the company due to negligence.
- Fiat Currency Risk – fiat currencies, which are used to buy and sell paper assets, are vulnerable to monetary risks such as inflation, hyperinflation, and devaluation.
On the other hands, there's no such risk profile for physical precious metals like gold or silver bars. Since they are physical possessions, there's no counterparty risk and throughout their millennia-long history the value of these assets has never hit zero.
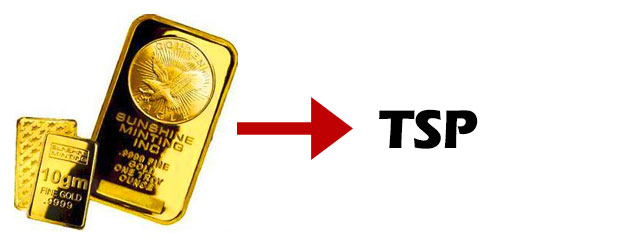
Benefits of Rolling Over a TSP Plan to a Precious Metals IRA
If you have left your federal post, consider rolling over some or part of your TSP funds into special kind of retirement account called a “self-directed IRA.” When you roll over your TSP into a self-directed IRA self-directed IRA you're given much more freedom to pick and choose the types of assets you want to invest in without a custodian or employer dictating what you can spend your money on. This includes precious metals.
Employer-sponsored plans, like TSPs, come with many caveats and are highly restricted regarding which assets you can invest in. Not only are your choices limited in the Thrift Savings Plan, but even decisions about when to change your portfolio are restricted. There's no denying that self-directed IRAs are the better option for investors seeking flexibility and freedom compared to TSPs or 401(k)s.
Why Dedicate 5-20% of Your Retirement Portfolio to Precious Metals
Gold and other precious metals are strategic tools. Not only do they hedge against risk by insulating a portion of your wealth from stock market volatility, but they're also known for their growth potential. Silver and gold aren't affected by inflation or bubble-like behavior in the stock market. Rather, they're safe and reliable stores of value for investors who want to minimize risk and maximize their chances of long-term gains.
Just last year gold broke new all-time highs above the $2,000/ounce mark. It may be that silver will follow suit in the years to come, as silver metals will play a major role in the incoming renewable energy revolution (did you know that 10% of the world's silver supply is used for manufacturing solar panels?).
Precious metals are a double-edged sword, invaluable as both a protection tool and a growth catalyst. How much of your wealth you dedicate to precious metals will depend on your age and time horizon, but, generally, investors allocate between 5 and 20 percent of their retirement portfolio to gold or silver. Typically, older investors near their target retirement age spend more on precious metals than younger investors who can afford to take on more risk.

 Gold: $3,329.45
 Silver: $36.82
 Platinum: $1,388.07
 Palladium: $1,153.30
 Bitcoin: $109,622.77
 Ethereum: $2,590.46
Interested in converting current TSP into gold also attempting to directing young son in military to start investing some of his TSP into precious metals. Thanks.
Can I purchase gold through the TSP ?
Hi Sylvester, yes you can contact either Noble Gold at (626) 605-3152 or Augusta at (844) 615-4484 as they both work with TSP rollovers to gold. I recommend you compare prices, products and services of both as they change frequently.
I am current fed employee who is 46 and have abour’t 25K in TSP and trying to figure out how to withdraw without a huge penalty into physical gold Ira hut keep reading that I can’t. Is this true?
Hi Sam, you should contact a Gold IRA company (see our list here: https://goldiraguide.org/companies/) and ask them what the costs and penalties would be to withdraw from your TSP account. They should be able to give you the most accurate and up to date answer.