- GOLD IRA
- Download Our 2024 Precious Metals IRA Investor’s Guide.
Click Here
 Gold IRA
- Investing
-
- CRYPTO IRA
- PRICES & STATS
- RETIREMENT PLANS
 Questions? Call (888) 820 1042

 Silver
 Gold
Gold Platinum
 Palladium
 Bitcoin
 Ethereum
Gold IRA Study: Backtesting Common Portfolios With and Without Gold Allocation
Disclosure: Our content does not constitute financial advice. Speak to your financial advisor. We may earn money from companies reviewed. Learn more
Last Updated on: 7th May 2024, 04:40 pm
When the Individual Retirement Account (IRA) was created by Congress in 1974, gold was one of several investments defined as “collectibles” that were prohibited from inclusion. That changed with the Taxpayer Relief Act of 1997.
Since then, there has been no prohibition on owning gold in an IRA. However, there are a few rules:
- The IRA must be self-directed
- The gold must meet purity standards
- The account must be managed by an accredited gold IRA custodian
Those restrictions apply to equally to individual IRAs, SEPs, and SIMPLE IRAs – all of which can all make direct investments in gold.[1]
According to the Investment Company Institute (ICI), there were some $13.6 trillion dollars invested in IRAs as of the end of 2023. Of that amount, ICI estimates that approximately 0.5% is invested in “unidentifiable assets,” which includes gold.[2]
It is estimated that more than 30 million American investors own gold. Of those some 2.3 million may own it in an IRA. Based on ICI data, total holdings in those IRA accounts is likely some amount less than $68 billion.
It is reasonable to conclude that some of that $68 billion in unidentifiable assets is gold, and that the relative number is so small may be because Americans are unaware that gold can be held in an IRA. In fact, a survey conducted by Gold IRA Guide revealed that 64% of investors asked were not aware that they could own gold in an IRA.
Table of Contents
- Does Including Gold In An IRA Make Sense?
- Baseline Allocations
- Asset Allocation with 5% Gold Exposure
- Asset Allocation with 10% Gold Exposure
- Asset Allocation with 25% Gold Exposure
- Historical Investment Returns
- Comparative CAGR
- Value of a $100,000 Investment After 52 Years
- Gold As A Diversification Tool
- Standard Deviation
- Comparison of Incremental Risk to Incremental Return
- Worst Five Years for Stocks - 1972 to 2023
- Portfolio Returns During Five Worst Years
- Maximum Drawdown
- Best Five Years for Stocks - 1972 to 2023
- Portfolio Returns During Five Best Years
- Gold As A Safe Haven [5]
- Conclusions
- Key Takeaways
Does Including Gold In An IRA Make Sense?
Gold may be a reasonable asset class to own in an IRA. It is not positively correlated to traditional stocks and bonds. It may provide a hedge against inflation. It may mitigate long-term portfolio volatility. And including gold may improve long-term total return.
Exploring these possibilities is the objective of this paper. To achieve this, we back-tested separate hypothetical portfolios using very recognizable asset allocation models – Aggressive, Balanced, and Conservative.
The baseline portfolios were constructed using three common asset classes: stocks, bonds, and cash.
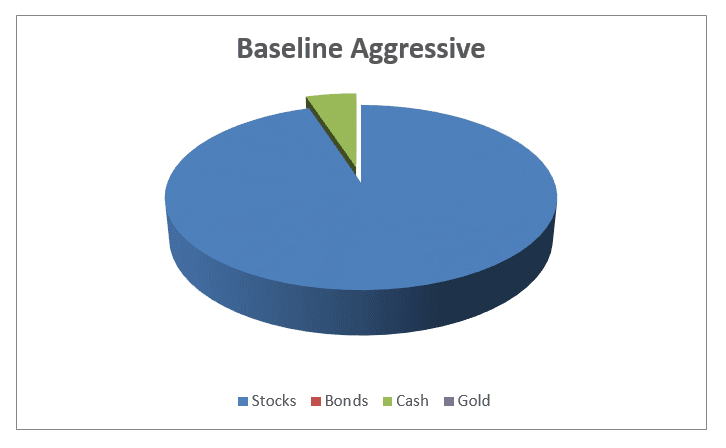
- The Aggressive portfolio is a mix of 95% US Stocks (stocks) and 5% 3-month US Treasury Bills (cash).[3]
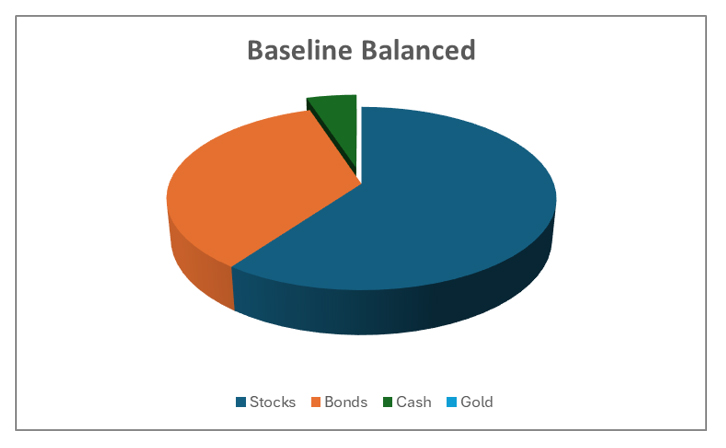
- The Balanced portfolio follows the investment industry’s standard 60/40 mix comprised of 60% stocks, 35% 10-Year US Treasuries (bonds), and 5% cash.
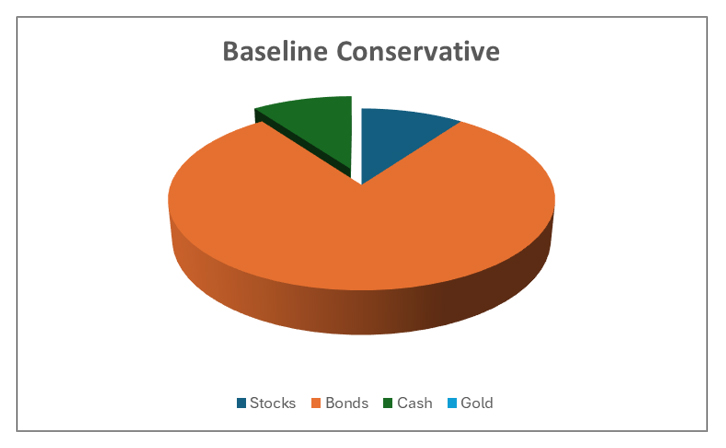
- The Conservative portfolio includes a 10% allocation to stocks, 80% to bonds, and 10% to cash.
These are illustrated in Table 1 below.
← Slide left and right to view more. →
Baseline Allocations
| Investment Objective | Stocks | Bonds | Cash | Gold |
|---|---|---|---|---|
| Aggressive | 95.00% | 0.00% | 5.00% | 0.00% |
| Balanced | 60.00% | 35.00% | 5.00% | 0.00% |
| Conservative | 10.00% | 80.00% | 10.00% | 0.00% |
Figures 1 through 3 illustrate the relative weight of stocks, bonds, and cash in each of the baseline portfolios.
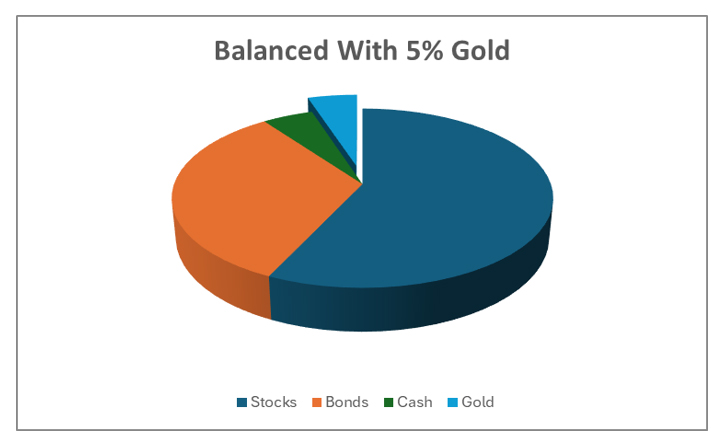
To these baseline portfolios we then add a gold component to come up with new asset allocations roughly following various investment strategies to fit different investors’ motives for owing gold.
The weighting of stocks, bonds, and cash decrease as gold is added to the mix as illustrated in Table 2.
← Slide left and right to view more. →
Asset Allocation with 5% Gold Exposure
| Investment Objective | Stocks | Bonds | Cash | Gold |
|---|---|---|---|---|
| Aggressive | 90.00% | 0.00% | 5.00% | 5.00% |
| Balanced | 57.00% | 33.00% | 5.00% | 5.00% |
| Conservative | 9.50% | 76.00% | 9.50% | 5.00% |
Figures 4 through 6 below illustrate the addition of a 5% gold allocation to each of the three baseline portfolios.


As more gold is added to each portfolio, the relative weighting of other assets decreases as shown in Table 3.
← Slide left and right to view more. →
Asset Allocation with 10% Gold Exposure
| Investment Objective | Stocks | Bonds | Cash | Gold |
|---|---|---|---|---|
| Aggressive | 85.50% | 0.00% | 4.50% | 10.00% |
| Balanced | 54.00% | 31.50% | 4.50% | 10.00% |
| Conservative | 9.00% | 72.00% | 9.00% | 10.00% |
Figures 7 through 9 represent the changes to each of the initial portfolios as more gold is added. The next three images represent a 10% allocation to gold.
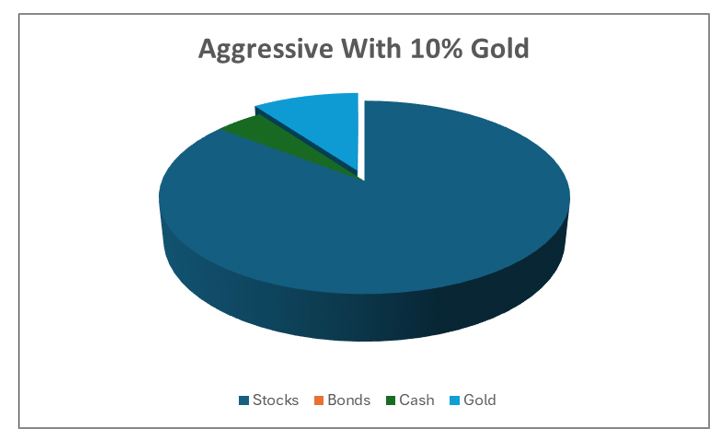
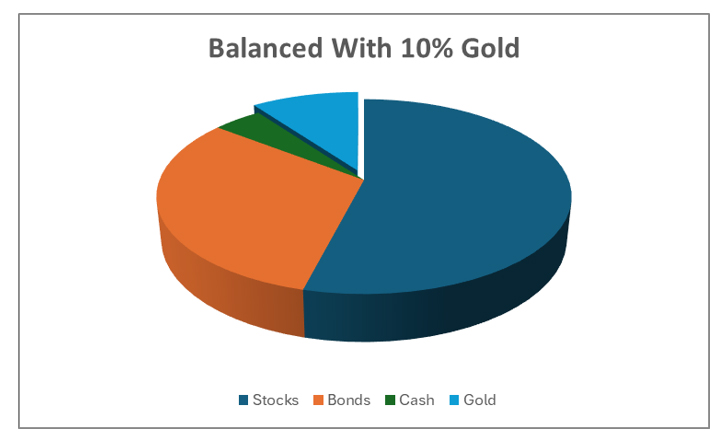
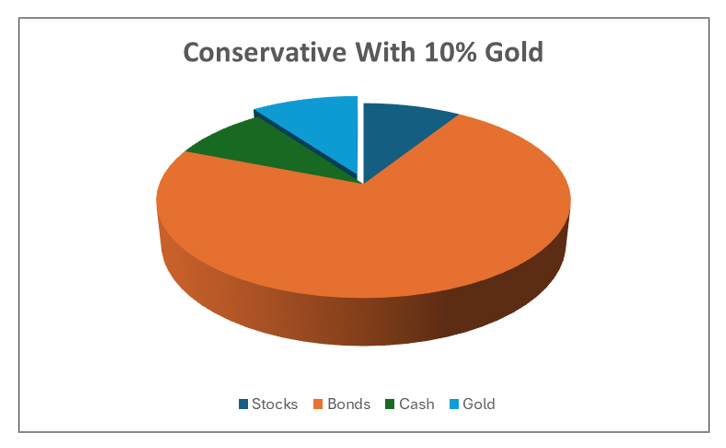
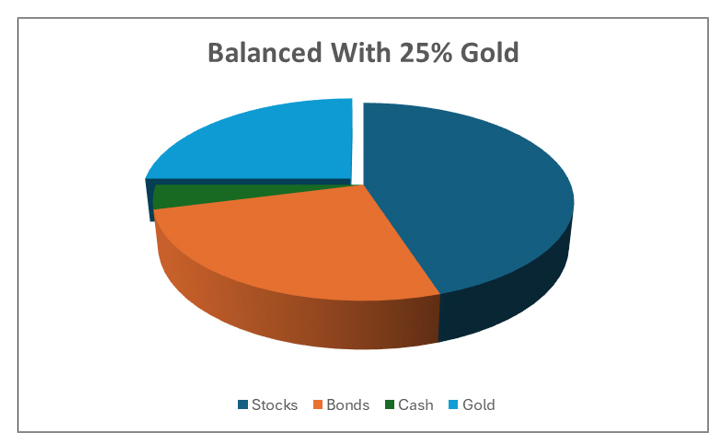
Table 4 below details the changes in asset allocation when gold represents 25% of the portfolios.
← Slide left and right to view more. →
Asset Allocation with 25% Gold Exposure
| Investment Objective | Stocks | Bonds | Cash | Gold |
|---|---|---|---|---|
| Aggressive | 70.00% | 0.00% | 5.00% | 25.00% |
| Balanced | 45.00% | 26.00% | 4.00% | 25.00% |
| Conservative | 7.50% | 60.00% | 7.50% | 25.00% |
Figures 10 through 12 illustrate what each portfolio looks like when the gold allocation equals 25% of the mix.


We used the actual annual returns of each asset class between January 1972 and December 2023 to determine the combined diversified returns of the twelve portfolios.
Historical Investment Returns
The next step in our study was to compare those returns. The effect of inflation on absolute returns is absent from our analysis. Similarly, taxes are not deducted from returns.
This is significant given that our methodology rebalanced each portfolio annually to maintain consistent year-over-year weightings between the various asset classes in them.
Rebalancing subjects a non-qualified account to taxable gains. Retirement accounts defer taxes until funds are withdrawn.
Also absent from our calculations are the potential account fees that one would expect in a real world scenario. We also assume that each of the baseline portfolios is funded with $100,000 beginning in January 1972.
Our backtesting showed that between 1972 and 2023 the baseline portfolios would have grown at compound annual growth rates (CAGRs) as follows:
- Aggressive – 10.43%
- Balanced – 9.32%
- Conservative – 6.79%
As table 5 below points out, these returns are enhanced as gold is added to each mix.
← Slide left and right to view more. →
Comparative CAGR
| Investment Objective | Baseline | +5% Gold | +10% Gold | +25% Gold |
|---|---|---|---|---|
| Aggressive | 10.43% | 10.52% | 10.59% | 10.55% |
| Balanced | 9.32% | 9.41% | 9.49% | 9.58% |
| Conservative | 6.79% | 6.98% | 7.15% | 7.57% |
The illustration below provides a graphic representation of the comparative CAGR of the various portfolios.
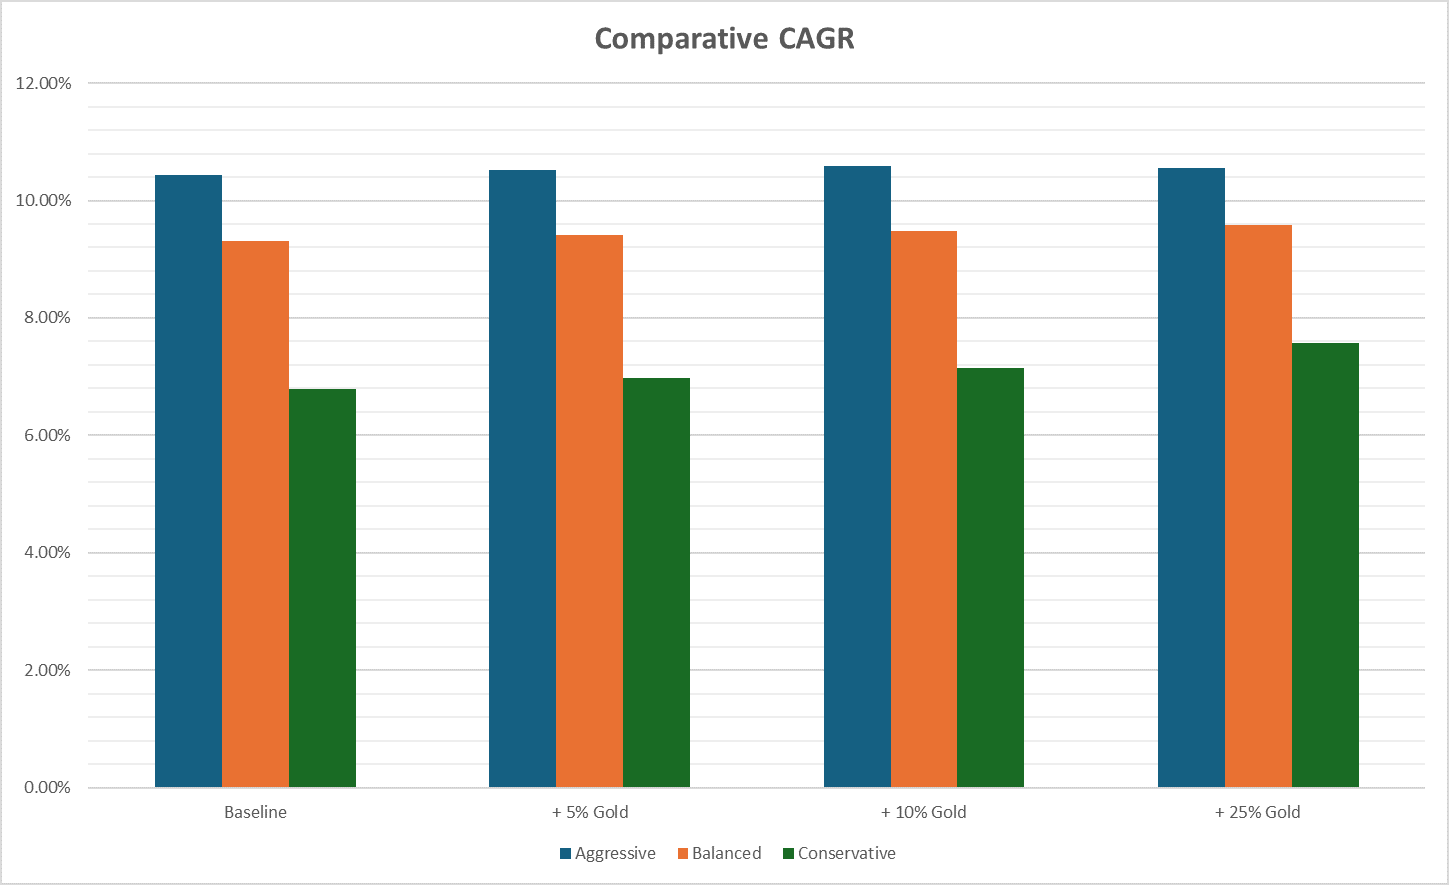
At the baseline CAGRs, the initial portfolios would have grown to more than $16 million, approximately $10 million, and over $3 million, respectively over the 52 years studied in this paper. The ending balances are higher as gold is added to each original asset allocation.
Table 6 below details the changes in portfolio balances for each mix.
← Slide left and right to view more. →
Value of a $100,000 Investment After 52 Years
| Investment Objective | Baseline | +5% Gold | +10% Gold | +25% Gold |
|---|---|---|---|---|
| Aggressive | 16,303,724 | 16,975,907 | 17,622,374 | 17,361,738 |
| Balanced | 9,947,109 | 10,378,890 | 10,765,830 | 11,217,260 |
| Conservative | 3,093,458 | 3,398,520 | 3,668,333 | 4,444,453 |
Gold As A Diversification Tool
As the table demonstrates, the inclusion of gold does appear to positively impact return. Adding gold to each of the baseline portfolios had a net positive effect on performance. But part of promise of diversification is risk mitigation.
Strategic asset allocation is intended to maximize long-term return while also reducing total portfolio volatility. So it is well to study the impact adding gold has on reducing overall portfolio risk – in this case, the standard deviation of the portfolio’s long-term return volatility.
During periods of short-term volatility, the total return of different asset classes may be uncorrelated. Traditionally portfolio managers have relied on the theory that a mix of stocks, bonds, and cash can mitigate the long-term standard deviation of a portfolio’s returns because the various asset components are not positively correlated.[4]
In this context, our baseline portfolios demonstrate unique risk profiles. The long-term standard deviation of the baseline portfolios was as follows:
- Aggressive – 14.93%
- Balanced – 9.99%
- Conservative – 6.76%
Adding gold to each of the baseline portfolios changes their risk profiles. Generally, those changes were positive (i.e., reduced risk). As Table 7 below illustrates, there was one exception.
← Slide left and right to view more. →
Standard Deviation
| Portfolio | Baseline | +5% Gold | +10% Gold | +25% Gold |
|---|---|---|---|---|
| Aggressive | 14.93% | 14.17% | 13.59% | 12.19% |
| Balanced | 9.99% | 9.58% | 9.32% | 9.31% |
| Conservative | 6.76% | 6.59% | 6.60% | 7.58% |
The Conservative portfolio with 25% gold saw an increase in long-term standard deviation of 82 basis points (0.82%). This additional risk (over the baseline) was not offset by a commensurate increase in return. The portfolio’s long-term CAGR rose by 78 basis points.
By replacing bonds with gold – so that it represents 25% of the Conservative portfolio’s assets – made it riskier without compensating the investor with an equal or higher return (over the baseline).
In every other case, the addition of gold lowered portfolio risk and increased portfolio return. This is illustrated in Table 8 below.
← Slide left and right to view more. →
Comparison of Incremental Risk to Incremental Return
| Portfolio | Baseline Risk/Return | +5% Gold Risk/Return | +10% Gold Risk/Return | +25% Gold Risk/Return |
|---|---|---|---|---|
| Aggressive | 14.93%/10.43% | 14.17%/10.52% | 13.59%/10.59% | 12.19%/10.55% |
| Balanced | 9.99%/9.32% | 9.58%/9.41% | 9.32%/9.49% | 9.31%/9.58% |
| Conservative | 9.76%/6.79% | 6.59%/6.98% | 6.60%/7.15% | 7.58%/7.57% |
The increase in the Conservative portfolio’s standard deviation happens because the additional gold exposure reduces the portfolio’s allocation to its least volatile asset (bonds).
Gold As A Hedge
Gold has traditionally been seen as a hedge against declines in the value of “paper” assets (stock and bonds). For example, during a market downturn, a portfolio holding gold is believed to perform better than a portfolio that does not hold gold. We tested this.
Our study compared the performance of each of the hypothetical portfolios during the five worst years for stocks between 1972 and 2024. They were – in order of magnitude – 2008, 1974, 2002, 2022, and 1973.
Table 9 below shows how each of the four asset classes performed during these five market environments.
← Slide left and right to view more. →
Worst Five Years for Stocks - 1972 to 2023
| Year | Stock Market | Cash | 10-Year | Gold |
|---|---|---|---|---|
| 2008 | -37.04% | 0.03% | -15.19% | 4.92% |
| 1974 | -27.81% | 0.04% | -10.17% | 66.15% |
| 2002 | -20.96% | 0.05% | -8.57% | 25.57% |
| 2022 | -19.60% | 0.05% | -7.83% | -0.77% |
| 1973 | -18.18% | 0.07% | -7.19% | 72.96% |
In every instance, gold outperformed stocks. Gold also outperformed bonds in each of the five years. Gold delivered positive returns in every year but one (2022).
Yet as Figure 14 below illustrates, holding gold – even when it represented 25% of the total – did not protect every portfolio against loss. For example, no portfolio experienced gains in 2002.

However, every portfolio – including the baseline models – outperformed the broader stock market in each of the five worst years. This is attributed to asset allocation. No portfolio included a 100% allocation to stocks.
The Conservative portfolios (with and without gold) fared better than the others in each of the five years. In fact, the four Conservative portfolios had positive returns in all but one of the downturn years.
Also notable is that the total return of the gold-holding Conservative portfolios improved over the baseline portfolio’s results in every year except 2008. This is highlighted in Table 10 below.
← Slide left and right to view more. →
Portfolio Returns During Five Worst Years
| Portfolio | 2008 | 1974 | 2002 | 2022 | 1973 |
|---|---|---|---|---|---|
| Baseline Aggressive | -35.11% | -26.02% | -18.53% | -18.53% | -16.92% |
| Baseline Balanced | -14.96% | -14.87% | -16.99% | -7.09% | -9.40% |
| Baseline Conservative | 12.88% | 1.27% | -13.93% | 10.43% | 1.53% |
| Aggressive +5% Gold | -33.01% | -21.32% | -17.59% | -17.50% | -12.36% |
| Balanced +5% Gold | -14.01% | -10.80% | -16.13% | -5.49% | -5.27% |
| Conservative +5% Gold | 12.48% | 4.51% | -13.27% | 11.19% | 5.10% |
| Aggressive +10% Gold | -31.11% | -16.80% | -16.76% | -15.29% | -7.93% |
| Balanced +10% Gold | -12.97% | -6.76% | -15.37% | -3.82% | -1.17% |
| Conservative +10% Gold | 12.08% | 7.76% | -12.62 | 11.94% | 8.67% |
| Aggressive +25% Gold | -24.62% | -2.53% | -13.82% | -8.20% | 5.87% |
| Balanced +25% Gold | -10.04 | 5.40% | -12.89% | 1.04% | 11.20% |
| Conservative +25% Gold | 10.89% | 17.49% | -10.64 | 14.21% | 19.39% |
Table 10 reveals something more about the portfolios with gold exposure. For the two other allocation models (Aggressive and Balanced), all of the portfolios with a gold allocation outperformed their respective baseline portfolio. This was the case in all five years.
Except as noted, including gold into each of the three baseline portfolios improved returns in nearly all five periods. In other words, most of the portfolios benefited from the addition of gold to the mix because it mitigated losses.
To further explore gold’s ability to decrease portfolio volatility, we reviewed the maximum drawdown of each portfolio over the 52-year period. Drawdown refers to a portfolio’s decline from a cyclical peak to a trough before recovering. As Table 11 below shows, the addition of gold to each of the baseline portfolios lessened the severity of those drawdowns.
← Slide left and right to view more. →
Maximum Drawdown
Baseline Aggressive | -14.69% |
| Aggressive +5% Gold | -45.93% |
| Aggressive +10% Gold | -43.32% |
| Aggressive +25% Gold | -34.11% |
Baseline Balanced | -28.03% |
| Balanced +5% Gold | -25.15% |
| Balanced +10% Gold | -23.11% |
| Balanced +25% Gold | -18.38% |
Baseline Conservative | -16.39% |
| Conservative +5% Gold | -15.59% |
| Conservative +10% Gold | -15.57% |
| Conservative +25% Gold | -16.03% |
But what would be the case in years where stocks rose at rates higher than their historical mean? To determine this, we looked at the five best performing years between 1972 and 2024. Those years were 1975, 1995, 2013, 1980, and 1991, in order of the magnitude of return (Figure 15).
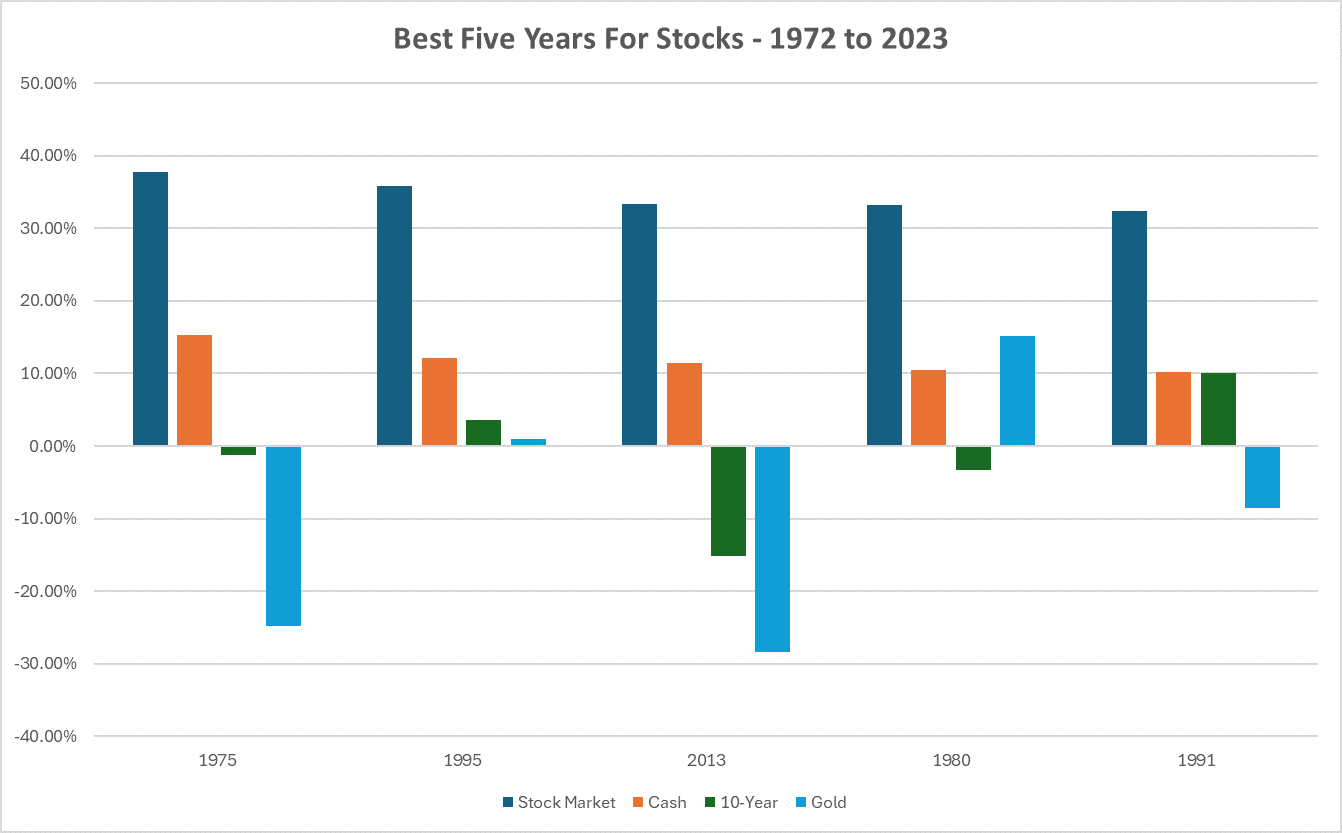
Stock market returns in each year exceeded 30%. In 1975 stocks advanced 37.82%. They were 35.79% higher in 1995. Stocks rose 33.35% in 2013. Prices increased 33.15% in 1980. And in 1991 they moved 32.39% higher.
Table 12 below shows that none of the other asset classes we studied achieved the returns that stocks delivered in any of those years.
← Slide left and right to view more. →
Best Five Years for Stocks - 1972 to 2023
| Year | Stock Market | Cash | 10-Year | Gold |
|---|---|---|---|---|
| 1975 | 37.82% | 15.29% | -1.30% | -24.80% |
| 1995 | 35.79% | 12.15% | 3.64% | 0.98% |
| 2013 | 33.35% | 11.45% | -15.19% | -28.33% |
| 1980 | 33.15% | 10.49% | -3.33% | 15.19% |
| 1991 | 32.39% | 10.17% | 10.01% | -8.56% |
Asset allocation, which was a benefit to each portfolio during market declines, acted to dampen portfolio returns during the five best years for stocks. Mixing different asset classes did not create negative returns. It just produced results that underperformed the broader stock market.
As a result, the baseline portfolios start out at a performance disadvantage before gold is added to each mix. This disadvantage remained mostly intact as gold was added to each portfolio. There were three exceptions. The three Conservative portfolios that held gold outperformed the baseline in 1980.
This can be attributed primarily to inflation that lingered into the new decade. With inflation came new record high prices for gold and higher interest rates, which drove bond prices lower. A greater than 15% increase in gold prices in 1980 significantly made up for the year’s 3% decline in bond values.
In every other case, portfolios with gold underperformed the market and their respective baseline asset allocations. This is detailed in Table 13 below.
← Slide left and right to view more. →
Portfolio Returns During Five Best Years
| Portfolio | 1975 | 1995 | 2013 | 1980 | 1991 |
|---|---|---|---|---|---|
| Baseline Aggressive | 36.23% | 34.28% | 31.68% | 32.10% | 31.06% |
| Baseline Balanced | 24.93% | 30.70% | 17.01% | 20.05% | 26.34% |
| Baseline Conservative | 8.81% | 24.59% | -3.52% | -3.50% | 18.94% |
| Aggressive +5% Gold | 33.10% | 32.54% | 28.60% | 31.20% | 29.01% |
| Balanced +5% Gold | 22.44% | 29.16% | 14.77% | 19.84% | 24.56% |
| Conservative +5% Gold | 7.13% | 23.41% | -4.76% | 4.08% | 17.56% |
| Aggressive +10% Gold | 30.13% | 30.95% | 25.68% | 30.41% | 27.10% |
| Balanced +10% Gold | 19.96% | 27.73% | 12.48% | 19.56% | 22.85% |
| Conservative +10% Gold | 5.45% | 22.23% | -600% | 4.67% | 16.19% |
| Aggressive +25% Gold | 20.58% | 25.58% | 16.26% | 27.61% | 20.82% |
| Balanced +25% Gold | 12.50% | 23.22% | 5.70% | 18.87% | 22.85% |
| Conservative +25% Gold | 0.41% | 18.69% | -9.72% | 6.42% | 12.06% |
It is important to note that portfolio performance numbers detailed in Table 13 represent five unique snapshots in time. They should not be taken out of context. Investing is a long-term pursuit. Success unfolds over time. Based on our research, it appears that the inclusion of gold in a portfolio produced a positive risk/reward tradeoff over the long term.
Gold As A Safe Haven [5]
There were seven significant stock market disruptions in the United States during the 52 years we studied.
- The first was the bear market that began in January of 1973 and continued for nearly two full years. During this time stocks sank some 45%. Yet, between January 1973 and December 1974, gold nearly tripled in value.
- The stock market crash on October 19, 1987 represented a 22% loss in value in one day, the worst since the panic in 1929. For the full year 1987, gold prices rose 24.46%.
- On Friday, October 13, 1989, stocks lost nearly 7% of their value in one day. This “Mini Crash” has been cited as an important cause of the early 1990s recession. Yet, from October 13, 1989 through the end of that year, gold prices rose nearly 10%.
- When the dot-com bubble burst on March 10, 2000, it precipitated a bear market that would last about two years. By December 31, 2001, the NASDAQ Composite Index had declined 62%. In those same 21 months, gold prices held somewhat more firmly, closing down just about -5%.
- Also in 2001, the US suffered its worst ever incident of terrorism on September 11th. That year saw the Dow Jones Industrial Average lose approximately 7% of its value while gold held steady and gained slightly more than 1% on the year.
- Before Lehman Brothers collapsed in 2008, stocks were already in the early stages of the bear market that began on October 11, 2007 and lasted at least until June 2009. During that period, equity markets lost more than 42% of their value while gold rose almost 25%.
- The stock market lost 22% of its value in the first quarter of 2020 as a result of the COVID-19 pandemic. Gold price rose more than 3% in those three months.
Conclusions
While US tax laws changed in 1997 allowing Americans to own gold in IRA accounts, only a small fraction of savers have taken advantage of the rule. According to the Investment Company Institute, less than 0.5% of the assets in IRAs appear to be invested in gold. In our view, this creates a huge opportunity for investors.
The opportunity may be even more compelling given that. Based on our analysis, the addition of gold to an IRA more often than not enhances portfolio returns. Importantly, the incremental improvement in return does not come with a burden of additional risk, especially over long periods of time. Our analysis shows that adding gold to a well-diversified durable portfolio of stocks, bonds, and cash actually reduced the portfolio’s risk of loss over the long haul.
While there will continue to be periods where stocks and bonds outperform gold in the short-term, and occasions when the precious metal may actually be a drag on performance, our work supports the notion that its inclusion does more good than harm. This is especially the case during periods of stock market disruption.
The addition of any other asset class to an all-equity portfolio necessarily reduces its return over the long term. This is indeed the case with fixed income and cash assets. The corresponding benefit of their inclusion, however, is risk mitigation.
Interestingly, our work did not find that adding gold to our baseline portfolios reduced their return. It was quite the opposite, especially over long holding periods. More importantly, adding gold augmented total return in a meaningful way across a risk tolerance continuum between conservative and aggressive.
In our opinion, the addition of gold in a retirement account makes sense. But investors are cautioned to be diligent when it comes to portfolio management. Gold needs to be considered in the context of one’s investment objectives and time horizons. It needs to be evaluated early in the portfolio construction phase of retirement planning. Considering gold in one’s retirement account needs to be weighed against the risk and return attributes of competing assets. One cannot own everything. However, our view is that gold ought to be seriously considered as an appropriate component of most investors’ strategic asset allocations. In addition, periodic rebalancing is imperative to achieving the type of long-term portfolio results that we observed in our study.
Anthony Termini is the former Managing Partner of Beta Capital, LLC, a private hedge fund in Reno, Nevada. He began his investment career in the mid-1980s at Kidder, Peabody & Company’s Private Client Group. After nearly 20 years in San Francisco with stints at Bear Stearns and Merrill Lynch, Tony joined Kochis Fitz (now Aspiriant), one of the largest independent Wealth Management firms in the country. He contributed to the books Wealth Management: A Concise Guide to Financial Planning and Investment Management for Wealthy Clients and Diversify or Die: Diversity. Inclusion. Evolution.
Success and is a frequent contributor to many financial publications.
Key Takeaways
- The ability to invest in physical gold in an IRA was added to retirement rules (ERISA, as amended) in 1997. Most Americans do not take advantage of the rule because they are not aware of it.
- Various sources estimate that the number of American investors who own gold in an IRA is between 2.3 million and 33 million people. According to the Investment Company Institute, total holdings in those IRA accounts is less than $68 billion.
- Based on research that studied annual returns from 1972 to 2024 back-testing three hypothetical baseline portfolios modeled to emulate traditional Aggressive, Balanced, and Conservative asset allocations, we conclude that when added to a well-diversified portfolio of stock, bonds, and cash gold investments helped to improve total return and reduce aggregate portfolio volatility.
a. In Aggressive portfolios gold provided 8 to 12 basis points of additional annual return based on its relative allocation
b. In Balanced portfolios gold provided 9 to 26 basis points of additional annual return based on its relative allocation
c. In Conservative portfolios gold provided 19 to 78 basis points of additional annual return based on its relative allocation
- The inclusion of gold reduced the maximum drawdown of each baseline portfolio over the 52 years studied and improved total return during the five worst years of stock market declines without significantly lowering returns during the five best years of stock market advances between 1975 and 2024.
a. In Aggressive portfolios gold reduced the maximum drawdown between 2.8% and 14.6% based on its relative allocation
b. In Balanced portfolios gold reduced the maximum drawdown between 2.9% and 9.7% based on its relative allocation
c. In Conservative portfolios gold reduced the maximum drawdown between 0.8% and 0.35% based on its relative allocation
- During each major anomalous short-term stock market disruption, gold outperformed stocks and would have provided a safe haven for investors during those tumultuous periods.
Sources
[1] Source: Internal Revenue Service, Publication 590-A.
[2] Source: Investment Company Institute.
[3] Sources of stock prices: AQR US MKT Factor Returns, 1972 to 1992 / Vanguard Total Stock Market Index Fund, 1993 to 2023.
[4] Source: Robert D. Arnott, CFA Institute, “Asset Allocation: The Challenges and Opportunities of Implementation”, 1987.
[5] Sources of gold prices: Gold Fixing Price in London Bullion Market, 1972 to 2004 / SPDR Gold Shares ETF, 2005 to 2023.


 Gold: $2,413.70
 Silver: $31.07
 Platinum: $1,060.73
 Palladium: $1,007.49
 Bitcoin: $67,020.90
 Ethereum: $3,094.48