- GOLD IRA
- Download Our 2024 Precious Metals IRA Investor’s Guide.
Click Here
 Gold IRA
- Investing
-
- CRYPTO IRA
- PRICES & STATS
- RETIREMENT PLANS
 Questions? Call (888) 820 1042

 Silver
 Gold
Gold Platinum
 Palladium
 Bitcoin
 Ethereum
The Japanese Yen Kick-Starts Stock Selloff and Gold Rally; Earnings So Far Disappoint.
Disclosure: Our content does not constitute financial advice. Speak to your financial advisor. We may earn money from companies reviewed. Learn more
Last Updated on: 25th December 2020, 05:55 am
The US dollar lost 2.15% against the Japanese yen in the space of 15 minutes after the Bank of Japan (BoJ) announcement on interest rates. The spin-off from this turmoil provoked a fall in the S&P 500 of 0.7% within the same space of time; both ending the day even lower. The US dollar had lost 3%, and the S&P 500 had lost 0.9% by the end of the day. There was also a second knock-on effect that caused a rally in Gold, which gained 1.64% in price on Thursday. The reaction to the rise in yen was not confined to one day, and Friday saw the US dollar depreciate by another 1.5%, the S&P 500 fell again by 0.63% and Gold continued its stride upwards by 2.1%.
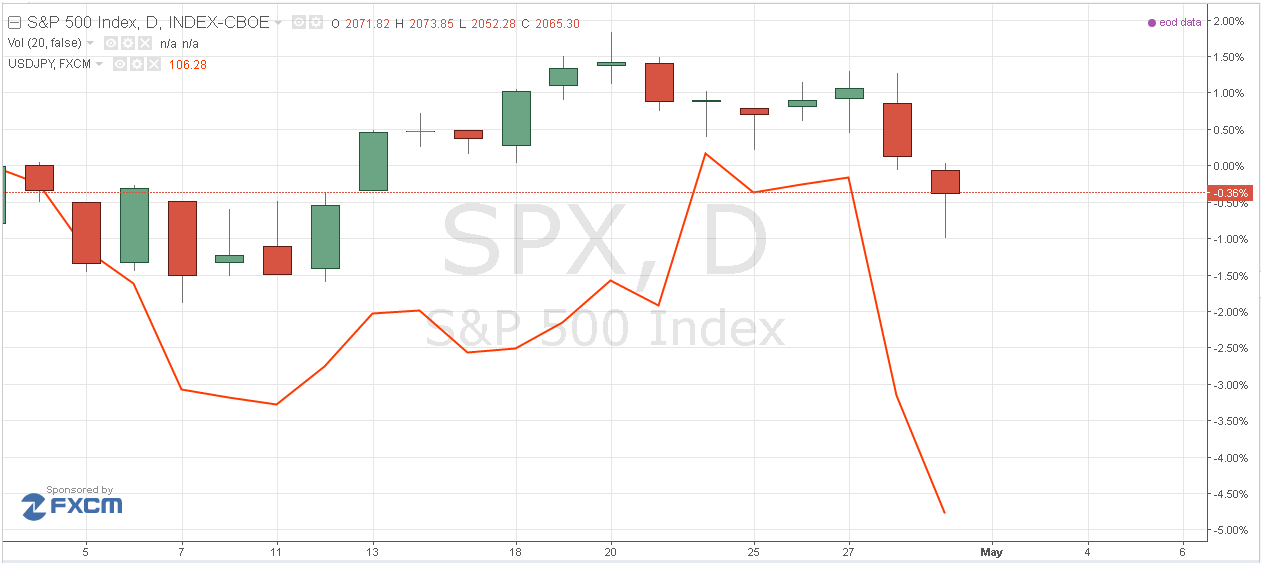 Source: Tradingview.com
Central bank decision making driving markets
What caused the yen to rise was the unexpected monetary policy stance from Japan. Thursday morning at 3 am GMT, the BoJ held interest rates steady and did not expand Quantitative Easing policies. The markets had expected some kind of increase in accommodating monetary policy, either a further decrease in interest rates, or more QE. Neither of those two possibilities was fulfilled, and that impacted the markets. The BoJ had already cut Interest rates to negative territory, at its scheduled January meeting, the main interest rate is currently at -0.1%. This move has not been very popular with the public at large and has also created some headaches for Japanese banks’ business models.
On Wednesday afternoon, the Federal Reserve had also decided to keep interest rates on hold at its scheduled Open Market Committee meeting. There had been some speculation as to the possibility of a small increase in interest rates or more hawkish talk in the after meeting statement. Neither of those events happened, as the statement from Fed Chair Yellen, if anything was Dovish. This put some pressure on the US dollar, but also on the stock market. In a way, the stock market is relieved that interest rates will not be going up too quickly, but this now raises concerns about the overall health of the economy. If the Federal Reserve cannot raise interest rates by ¼% how strong exactly is the economy?
Stock – Yen – Gold correlation
The correlation between Gold and Stocks is well known and easily recognized over the decades. When there is a stock market rout, Gold benefits in price, as it is seen as a haven. It comes as no surprise then that the last two negative trading sessions for the stock market have resulted in two positive days for Gold. The stock market may be set for more of a correction as the correlation between stocks and Japanese yen also comes into play. This is also a negative correlation when yen rises the stock market falls.
If we look back to 2007 at the onset of the financial crisis, we can see this correlation in play in a visually identifiable way. From November 2007 to March 2009 the S&P 500 dropped 57.2%, during the same period the yen rose by 18.9% to the dollar. In that period the stock market led the way as investors’ flight from stocks found its way into the Japanese yen. This time, it looks like the yen is taking the lead, as sharp increases in its value puts pressure on stock prices. The stress is easily felt in current market conditions as the broad stock market is not looking at its healthiest.
Earnings showing an unpromising outlook
So far, earnings have been released for 62% of companies in the S&P 500; with 74% reporting earnings were above estimates and 55% reporting that sales were above estimates. That sounds kind of positive but the blended earnings shows a decline of -7.6%; this number is for those companies that have reported so far, of course. If the index total were to be negative again, it would be the first time since 2009 that earnings decline over four consecutive quarters. Looking to the next quarter, 36 companies have issued negative EPS guidance while 18 have issued positive EPS guidance.
The chart below shows the S&P 500 index against its Forward 12-Month Earnings per Share. We can see that from 2014 EPS has remained flat and towards the downside, while the S&P 500 index has continued to rise. Either EPS has to increase further to justify the current levels of the index or the index has to fall to reflect current earnings conditions.
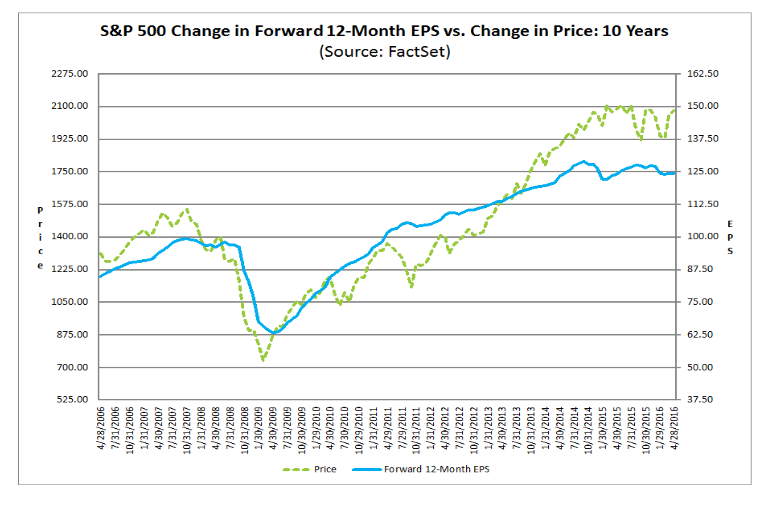 Source: FactSet.com
Other economic data released over the past week also shows a certain weakness in the economy as a whole. Last Tuesday we saw the release of Durable Goods Orders, which is a gauge of economic conditions. The figure forecast for this data was an increase of 1.8%. However, the actual release showed a smaller increase at 0.8%. On Thursday preliminary GDP was released at 0.7% slightly lower than last month’s 0.9%.
The Federal Reserve may have a hard time raising interest rates at a consistent pace if data does not hold up. Slowing down the speed of interest rate hikes would be beneficial to the stock market. On the other hand, if that is due to poor economic data or signs of a contracting economy things could get bad for stocks all the same.


 Gold: $2,316.06
 Silver: $27.31
 Platinum: $970.05
 Palladium: $953.36
 Bitcoin: $62,525.10
 Ethereum: $3,012.16